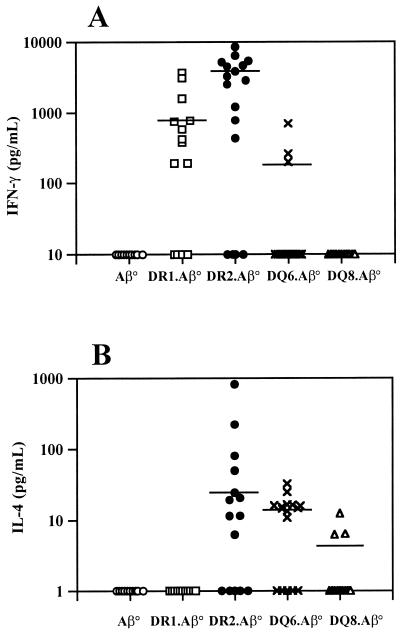
FIG. 5.
Cytokine production showing IFN-γ (A) and IL-4 (B) levels in the sera of infected transgenic and control Aβ° mice at 42 days p.i. Mice were individually tested. Cumulative results of three independent experiments are represented. The numbers of mice used for each strain were as follows: 11 for Aβ° mice (○), 19 for DR1.Aβ° mice (□), 18 for DR2.Aβ° mice (●), 17 for DQ6.Aβ° mice (×), and 12 for DQ8.Aβ° mice (▵). The choices of 10 pg/ml (IFN-γ) and 1 pg/ml (IL-4) is an arbitrary representation of sera detected below the cutoff of our ELISA test, calculated as the concentration at (mean ± 3 standard deviations) of the background. Statistical analysis using the Student's t test gave concentrations of IFN-γ in DQ6.Aβ° mice significantly lower than those in DR2.Aβ° mice sera (P = 0.026). Also, the amounts of IL-4 detected in DQ6.Aβ° mice were significantly lower than in DR2.Aβ° mice sera (P < 0.01).

