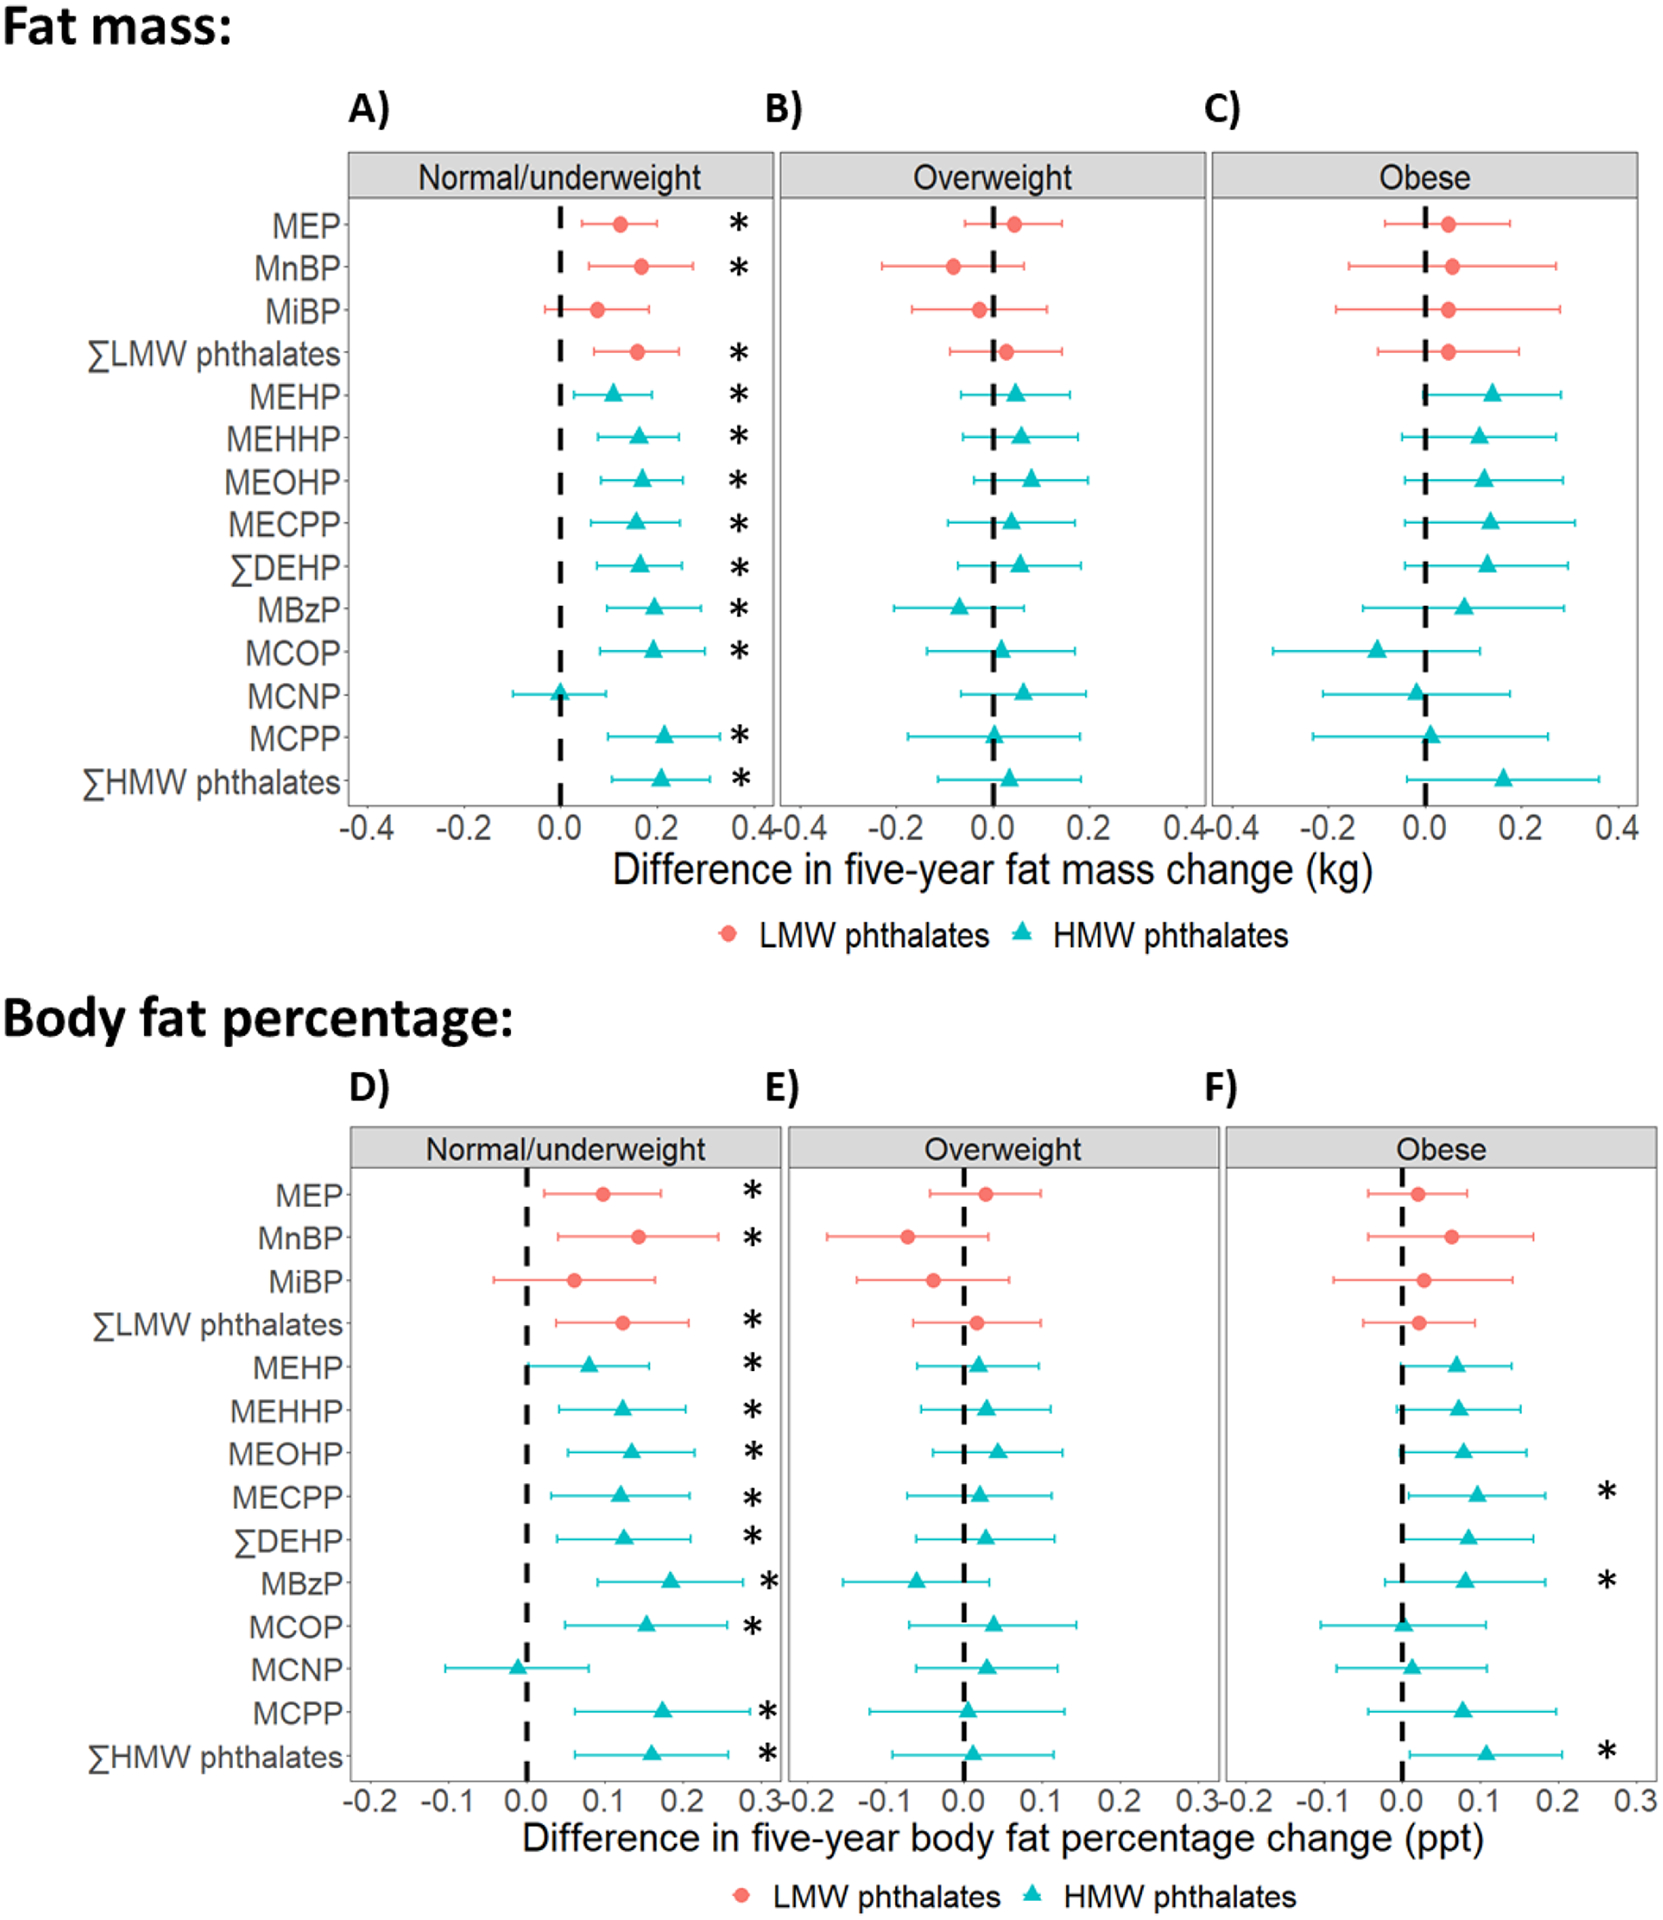
Fig 4. Differences in five-year fat mass and body fat percentage changes per doubling of phthalate metabolite concentrations, by baseline obesity status.

Results were based on 4750 observations from 499 women who were normal/underweight, 3942 observations from 403 women who had overweight, and 4054 observations from 442 women who had obesity. Differences were adjusted for age at baseline (1999/2000), race/ethnicity, site, the interaction between time and site, education level, daily dietary energy intake at baseline, and time-varying physical activity, smoking status, menopausal status, and use of hormone therapy. ∑LMW phthalates = molar sum of MEP, MnBP, and MiBP; ∑DEHP = molar sum of MEHP, MEHHP, MEOHP, and MECPP; ∑HMW phthalates = molar sum of MEHP, MEHHP, MEOHP, MECPP, MBzP, MCOP, MCNP, and MCPP. * = p-value < 0.05.
