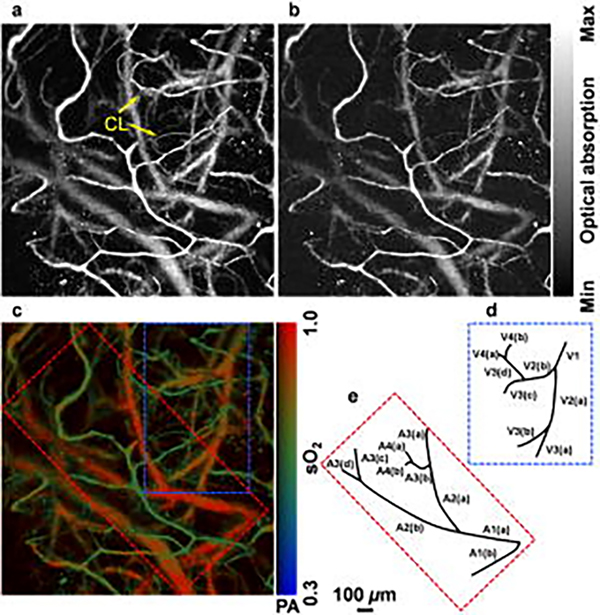
Figure 3.
(a), (b) Maximum intensity projection of PAI at 570 and 578 nm through the intact mouse skull. (c) Oxygen saturation map. (d),(e) Venular and arteriolar tree derived from the oxygen saturation map blue and red subsets. Reprinted with permission from67.

