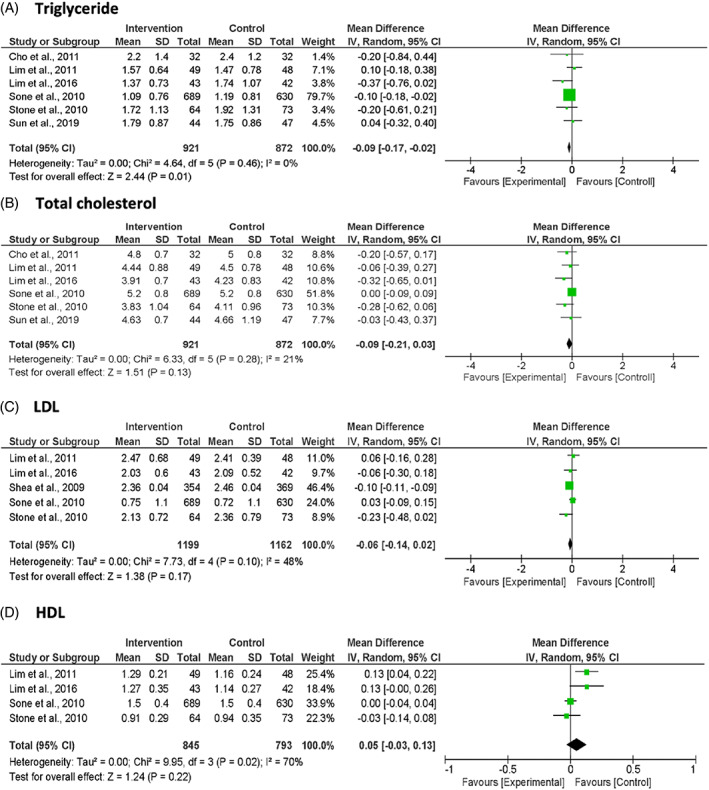
FIGURE 3.

Forest plots of blood lipid profile: (A) Triglyceride, (B) total cholesterol, (C) LDL‐cholesterol, (D) HDL‐cholesterol. Units are expressed as mmol/L.

Forest plots of blood lipid profile: (A) Triglyceride, (B) total cholesterol, (C) LDL‐cholesterol, (D) HDL‐cholesterol. Units are expressed as mmol/L.