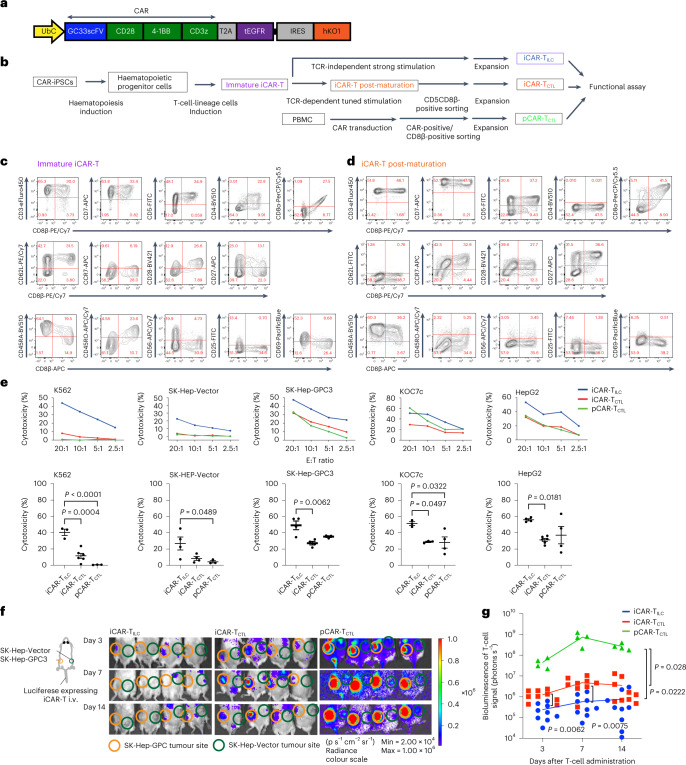
Fig. 2. iCAR-TCTL suppressed tumour progression and accumulated to the tumour site in vivo better than iCAR-TILC but did not reach pCAR-TCTL.
a, Schematic presentation of the GC28bbz CAR construct conjugated with tEGFR genes by aT2A. The construct was inserted at an internal promotor, UbC, of the lentiviral vector pCS-UbC-RfA-IRES-hKO1. b, Schematic illustration of the differentiation of iCAR to iCAR-T post-maturation. c,d, Surface antigen profiles of immature iCAR-T (c) and iCAR-T post-maturation (d) from CD3-positive αβT-iPSCs (clone TKT3V1-7) lentivirally transduced with GC28bbz CAR. The results show surface protein expression patterns on day 21 on OP9-DL1. Each number in the panels indicates the percentage of cells in the corresponding red rectangles. e, 51Cr release assay of iCAR-TCTL, iCAR-TILC and pCD8CART against GPC3-positive (SK-Hep-GPC3, Koc7c and HepG2) or negative (SK-Hep-Vector and K562) cancer cell lines. n = 3–6, mean ± s.e.m. statistical tests. The bottom panel shows the cytotoxicity at E:T ratio of 20:1. One-way ANOVA with Tukey’s multiple comparisons test. f, Five million SK-Hep-GPC3 and SK-Hep-Vector cancer cell lines were inoculated at the left or right flank of an NSG mouse, respectively. Next, 1 × 10⁷ luciferase-transduced iCAR-TCTL, iCAR-TILC or pCAR-TCTL were injected intravenously (i.v.) from the tail vein 14 days after the tumour inoculation. In vivo imaging surrounding the tumour inoculation sites. Orange and green circles indicate measurements obtained from the sites inoculated with SK-HEP-GPC3 and SK-Vector, respectively. g, Total flux (photons s−1) of the injected iCAR-T or pCAR-T cells in the SK-Hep-GPC3 tumour was quantified at the indicated timepoints. n = 9 (iCAR-TILC, iCAR-TCTL), n = 4 (pCAR-TCTL) mean ± s.e.m. Two-way ANOVA with Tukey’s multiple comparisons test.

