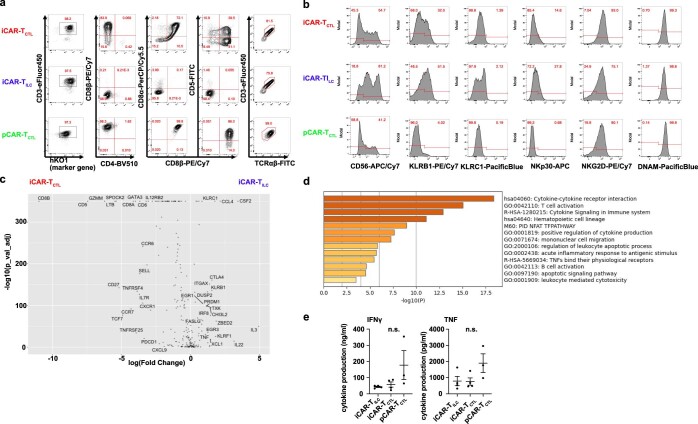
Extended Data Fig. 2. GPC3 CAR-iPSCs generated two types of iCAR-T cells with distinct phenotypes.
a. Representative flow cytometry plots showing T cell lineage-related surface antigen profiles of iCAR-TCTL, iCAR-TIL, and pCAR-TCTL. b. Flow cytometry plots showing the expression of surface markers associated with the NK cell lineage on iCAR-TCTL, iCAR-TILC, and pCAR-TCTL. c. Volcano plot of DEGs between iCAR-TCTL and iCAR-TILC. d. The list of upregulated genes in iCAR-TCTL. Pathway and process enrichment analysis was performed using online tools in Metascape (http://metascape.org/)49. e. Cytokine production of iCAR-TCTL, iCAR-TILC, and pCAR-TCTL 48 h after co-culturing with irradiated SK-Hep-GPC3 (n = 3, mean ± SEM). ns, not significant. One-way ANOVA with Tukey’s multiple comparisons test.

