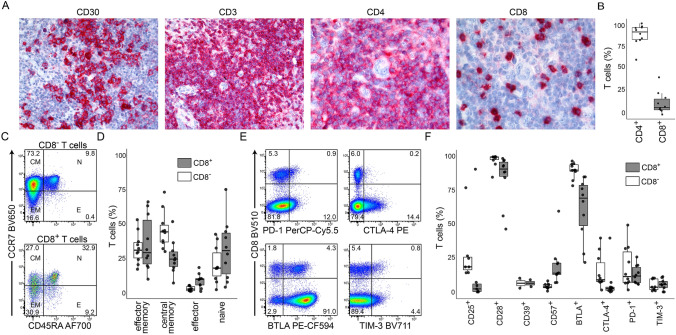
Fig. 1.
Immune phenotypes of lymph node-infiltrating T cells. A Immuno histology of one representative classical Hodgkin lymphoma lymph node. Data from patient CHL003 (mixed cellularity subtype) are shown as a representative example. B Frequencies of CD4+ and CD8+ cells among total αβ T cells within Hodgkin lymphoma lymph nodes determined by flow cytometry. Data points indicate n=10 individual patients. C Identification of naïve “N”, effector “E”, central memory “CM”, and effector memory “EM” populations within CD8+ and CD8- T cells from patient CHL003 as an example. Plots are pre-gated on live single TCRαβ+ cells (gating strategy in Suppl. Fig. 1). D Frequencies of T cell subpopulations as shown in (C) within all patients. Data points indicate n=10 individual patients. E Detection of checkpoint molecule expression on αβ T cells from patient CHL003 as an example. Plots are pre-gated on live single TCRαβ+ cells. Gates for PD-1, CTLA-4, and TIM-3 were defined based on expression on non-T cells. F Checkpoint molecule/functional marker expression on lymph node-infiltrating αβ T cells determined by flow cytometry as shown in (E). Data points indicate individual patients. Data are representative for n=10 individual patients, except for CD39 (n=2), CD25 (n=7), and TIM-3 (n=9). In all box plots, lower and upper hinges correspond to the 25th and 75th percentiles, whiskers extend from the hinges to largest and smallest values but no further than 1.5 x interquartile range, all other data points are shown as outliers. AF indicates AlexaFluor; BV, Brilliant Violet; PerCP, peridinin chlorophyll protein; Cy, cyanine; PE, phycoerythrin; and CF, cyanine-based fluorescence.

