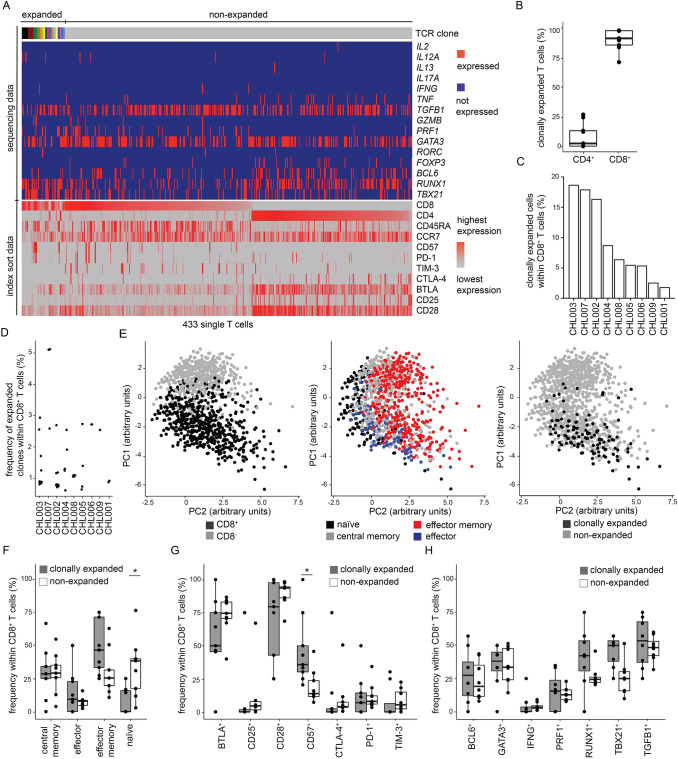
Fig. 2.
Clonal T cell expansion-associated immune phenotypes. A Sequencing of TCRαβ, transcription factor, and cytokine genes from amplified cDNA of single FACS-sorted T cells. The heatmap shows data of patient CHL003 as an example (heatmaps of all patients in Suppl. Fig. 2). Single cell data are arranged in columns with each column representing one single cell. The top bar indicates TCR sequences; adjacent columns with the same color in the top bar indicate single cells with identical CDR3 amino acid sequences of TCRαβ genes. T cell clones were defined expanded if we detected at least two cells with identical TCRαβ CDR3 amino acid sequences within individual lymph nodes. The lower part of the heatmap visualizes corresponding FACS index sort data (Suppl. Fig. 1 for sort gates). B Expression of CD4 and CD8 on clonally expanded lymph node-infiltrating T cells. Data points indicate individual patients. C Frequencies of clonally expanded T cells within total CD8+ T cells. D Sizes of expanded clones measured by frequencies within CD8+ T cells. Data points indicate individual expanded T cell clones. E Principal component analysis taking into account differentiation state and individual marker expression (detailed list in Suppl. Tab. 3) of all sequenced T cells. Data points indicate individual cells. F Differentiation of clonally expanded and non-expanded CD8+ T cells. G Surface marker expression on clonally expanded and non-expanded CD8+ T cells determined by FACS index sorting. Individual data points indicate n=9 patients, except for CD25 (n=6). H Parameters determined by single cell gene expression within clonally expanded and non-expanded CD8+ T cells. Visualized markers reached expression in at least 5% of T cells (Suppl. Fig. 3 for all markers). Individual data points indicate n=8 patients. PC indicates principal component. In all box plots, data points indicate individual patients; lower and upper hinges correspond to the 25th and 75th percentiles, whiskers extend from the hinges to largest and smallest values but no further than 1.5 x interquartile range, all other data points are shown as outliers. Statistical significance was calculated using the Wilcoxon Rank-Sum Test and corrected for multiple testing by Bonferroni adjustment, *p<0.05

