
Figure 3. Integrated predictiveness curve.
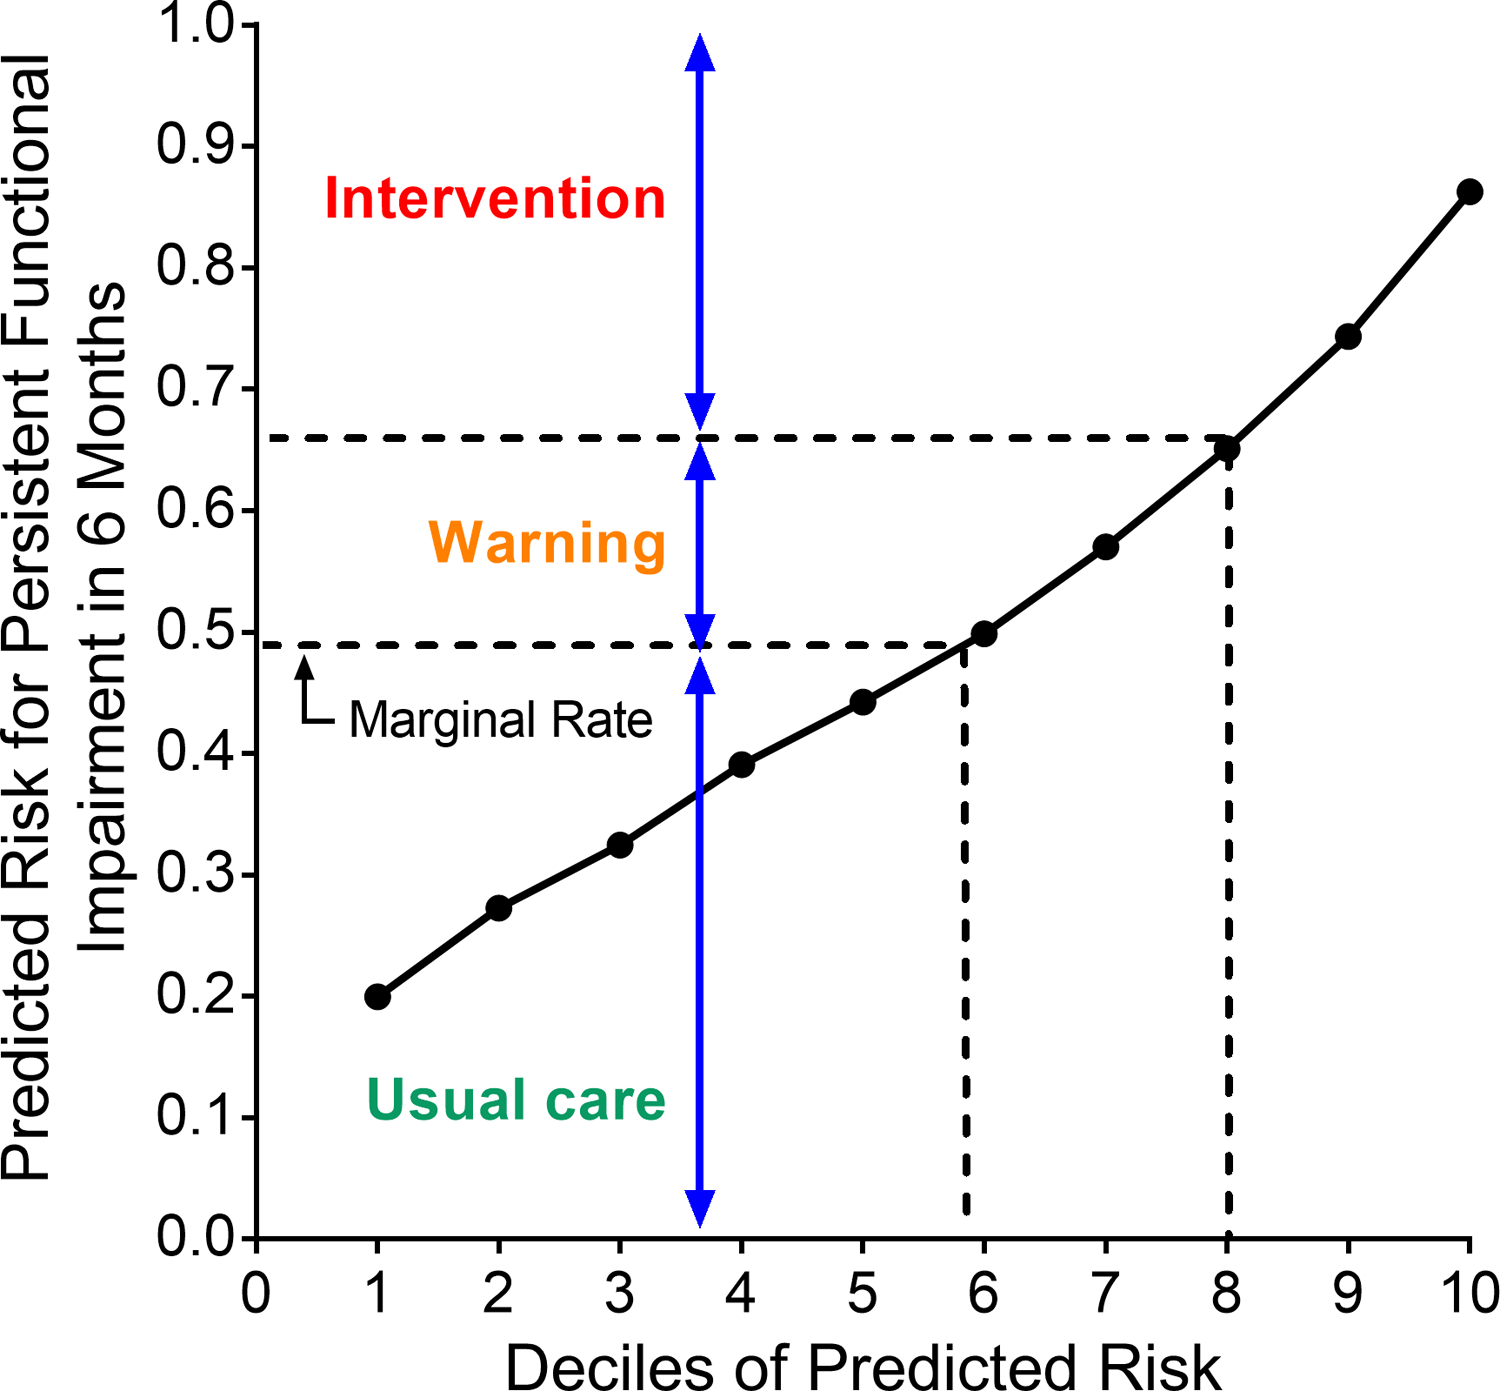
The curve is based on the predicted probabilities in the development cohort, with the marginal rate of the observed outcome (49.3%) denoted by the arrow. Using clinical judgment, the range of predicted risk between 49.3% and 65% (the 7th decile) was chosen as the “warning” range, in which the provider would warn the patient about their risk for persistent post-ICU functional impairment, while values greater than 65% predicted risk denoted the “intervention” range.