. 2022 Oct 4;306(2):e220266. doi: 10.1148/radiol.220266

Figure 4:

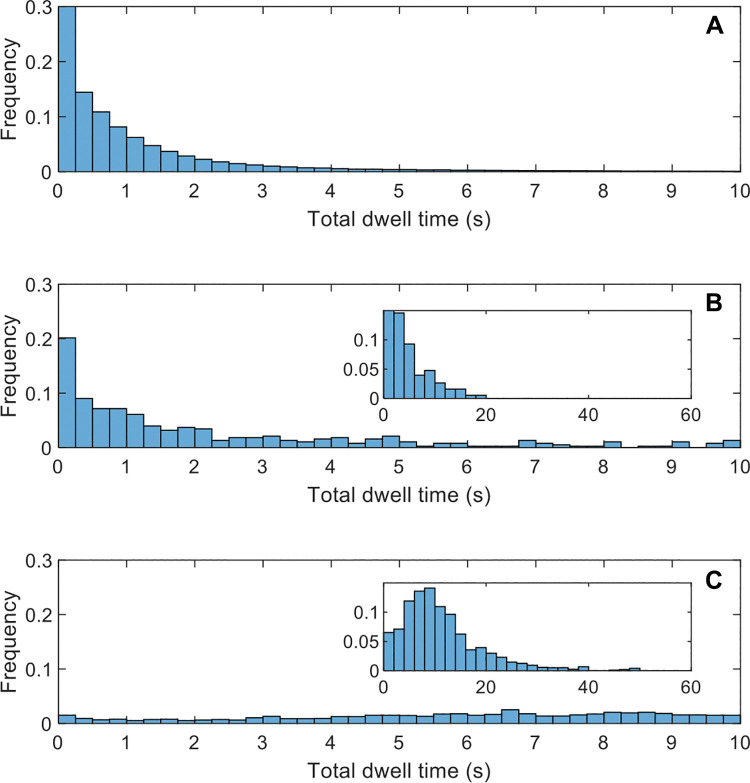
Graphs show gaze time distributions. Frequency is normalized so that the sum of all bars is 100%. Insets in B and C show a modified x-axis range to capture gaze times longer than 10 seconds. All histograms use bar widths of 0.25 second, except for the insets, which use 2 seconds. (A) Gaze for a stereologic grid of points in the liver, indicating that most of the liver was examined, at least briefly. (B) Gaze time for missed metastases (false-negative findings). Inset shows a modified x-axis range to capture gaze times longer than 10 seconds. (C) Gaze time for detected metastases (true-positive findings).

Graphs show gaze time distributions. Frequency is normalized so that the sum of all bars is 100%. Insets in B and C show a modified x-axis range to capture gaze times longer than 10 seconds. All histograms use bar widths of 0.25 second, except for the insets, which use 2 seconds. (A) Gaze for a stereologic grid of points in the liver, indicating that most of the liver was examined, at least briefly. (B) Gaze time for missed metastases (false-negative findings). Inset shows a modified x-axis range to capture gaze times longer than 10 seconds. (C) Gaze time for detected metastases (true-positive findings).