. 2022 Oct 4;306(2):e220266. doi: 10.1148/radiol.220266

Figure 6:

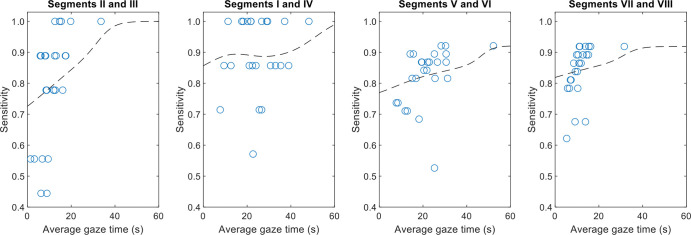
Graphs show sensitivity as a function of gaze time in liver segments grouped by location, along with a smoothed trend line. In most cases, longer gaze time in segments indicated higher sensitivity in those segments. Linear associations were significant for segments II and III (P = .002), V and VI (P = .04), and VII and VIII (P = .02) but not for segments I and IV (P = .27).

Graphs show sensitivity as a function of gaze time in liver segments grouped by location, along with a smoothed trend line. In most cases, longer gaze time in segments indicated higher sensitivity in those segments. Linear associations were significant for segments II and III (P = .002), V and VI (P = .04), and VII and VIII (P = .02) but not for segments I and IV (P = .27).