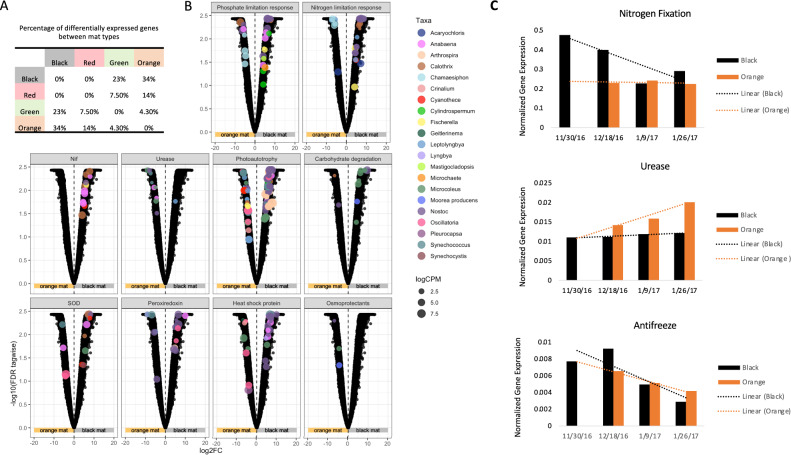
Fig. 5. Differential Expression Analyses.
A Venn diagram showing the percentage of significantly differentially expressed ORFs between mat types. B Differential expression of ORFs between orange and black mat pseudo replicates (12/18/16, 1/9/17 and 1/28/17). The following facet labels represent the collection of pathway-critical genes, referenced in Chan et al. [85] to depict functional processes: Nutrient limitation: “Phosphate limitation response”, “Nitrogen limitation response”. The following genes were used for detection of phosphate limitation: Alkaline phosphatase response regulators, high affinity phosphate-specific ABC transport genes, phoA, phoB, pstSCAB. For nitrogen limitation the following genes were used: glutamine synthase and regulators glnA, glnR, tnrA. Nitrogen cycling: Nitrogen fixation “Nif”, “Urease”. Carbon cycling “Photoautotrophy”, “Carbohydrate degradation”. Stress responses: Superoxide Dismutase “SOD”, “Peroxiredoxin”, “Heat shock protein” and “Osmoprotectants”. Significantly differentially expressed ORFs are colored by taxonomy and scaled by abundance. C Library-normalized expression of (top) nitrogen fixation, (middle) urease, and (bottom) antifreeze ORFs from black and orange mats over time. This analysis highlights the expression of several individual genes over at the single time point level. Additionally no orange mats were present in the streams at the November time point.

