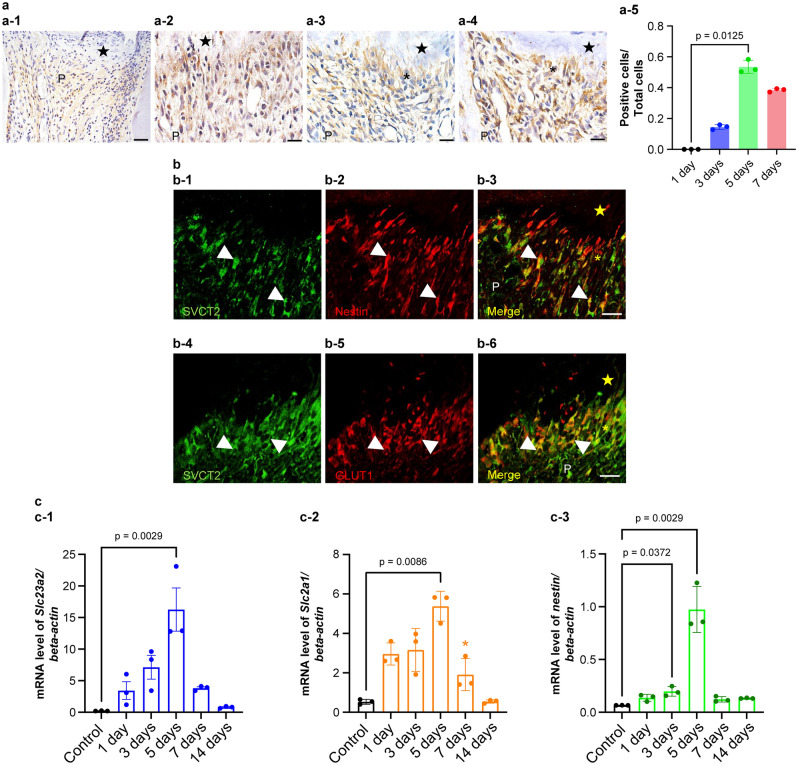
Figure 3.
Alteration of SVCT2 expression over time in the pulp tissue after pulpotomy followed by MTA capping. (a) Immunohistochemistry of SVCT2 in the coronal pulp tissue of the injured teeth at (a-1) 1, (a-2) 3, (a-3 and b-1–b-6) 5, and (a-4) 7 days after pulpotomy (n = 3 at each time point). (a-2) At 3 days after pulpotomy, immunoreactivities of SVCT2 were seen throughout the pulp tissue. Reparative dentin initiated to be formed from (a-3) 5 days after pulpotomy. Immunoreactivities of SVCT2 detected the newly differentiated osteoblast-like cells below the reparative dentin at (a-3) 5 and (a-4) 7 days after pulpotomy. (b) SVCT2 localization is recognized in the odontoblast-like cells 5 days after pulpotomy. (b-1 and b-4) SVCT2 staining (Green). (b-2) Nestin staining (odontoblast marker, red). (b-5) GLUT1 staining (Red) (b-3 and b-6) Merged images. The arrowheads indicate odontoblast-like cells that represented double positivity for SVCT2 and Nestin. (c) Slc23a1 (cording SVCT2), Slc2a1 (cording GLUT1), and Nestin mRNA expression in rat first molars after pulpotomy followed by MTA capping. Real time PCR used to quantify (c-1) Slc23a1, (c-2) Slc2a1, and (c-3) Nestin mRNA levels in normal first molar tissue and at each analyzed time point after pulpotomy. Data exhibit the mRNA expression levels of Slc23a1, Slc2a1, and Nestin normalized to β-actin mRNA level. Bars exhibit mean values ± standard error of the mean compared with controls (n = 3 for each group; only comparisons with p-value ≤ 0.05 are shown), Kruskal–Wallis test followed by Dunn's post hoc test. All mRNA levels peaked 5 days after pulpotomy. The closed star indicates the area exposed by a bur and capped with MTA. The asterisks indicate the odontoblast-like cell layer. The closed stars indicate the necrotic layer or reparative dentin layer. P, pulp. Scale = 20 μm.

