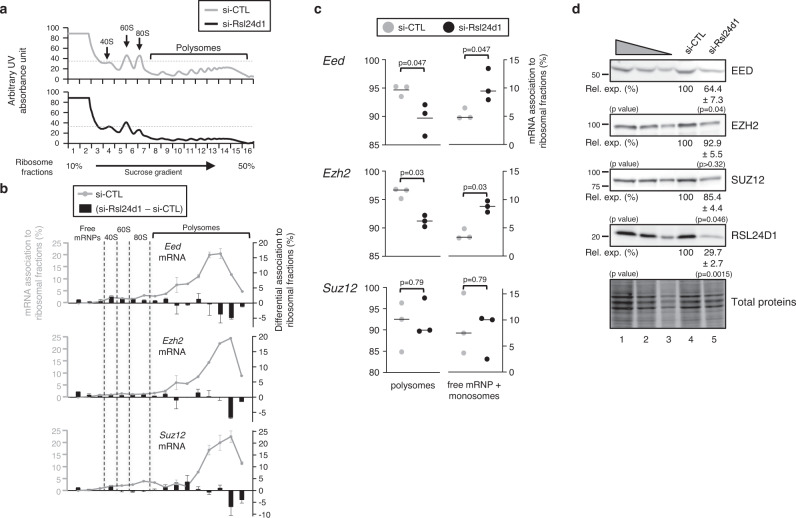
Fig. 5. RSL24D1 depletion impairs the translation of core PRC2 factors.
a Polysome profiling obtained after centrifugation on sucrose gradients of cytoplasmic extracts from naïve pluripotent CGR8 cells treated with non-targeting (si-CTL, gray) or Rsl24d1-targeting siRNAs (si-Rsl24d1, black). 40S, 60S, 80S monosomes and polysomes are detected by UV-absorbance and indicated on the absorbance curve. b Graphs representing Eed, Ezh2, and Suz12 mRNA levels measured by RT-qPCR in each fraction collected from three independent polysome profiling assays (gray curves, left scales) after normalization with a Luciferase spike-in mRNA and relative to the total amount of mRNAs detected in the polysome profiling (sum of all fractions). The bar graph represents the differential detection of each mRNA in each fraction in CGR8 cells treated with si-Rsl24d1 and control siRNAs (black bars, right scales). c Dot plots representing the relative proportions of Eed, Ezh2, and Suz12 mRNAs detected by qRT-PCR in free mRNPs/monosomal or polysomal fractions, based on quantifications detailed in the Fig. 5b, in si-CTL (gray) or si-Rsl24d1 (black) treated CGR8 ESCFBS (n = 3). Two tailed Student’s t test. d Representative immunoblots of RSL24D1 (n = 3), EED (n = 3), EZH2 (n = 3) and SUZ12 (n = 4) in si-CTL or si-Rsl24d1 treated CGR8 ESCFBS. Lanes 1 to 3 correspond to serial dilutions of si-CTL-treated ESCFBS (1:1, 1:3, and 1:9, respectively). TCE-labeled total proteins are used for normalization. Quantifications of immunoblot signals normalized to total proteins and relative to the si-CTL-treated conditions (Rel. exp. (%)) are indicated. Two tailed Student’s t test.

