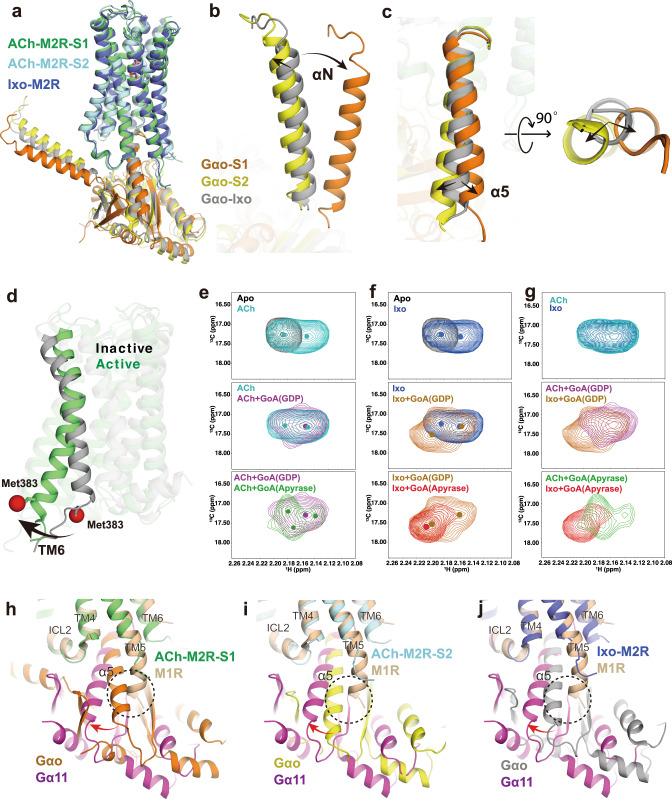
Fig. 5. Comparison of ACh and Ixo stabilized G-protein complex.
a Comparison of the orientation of Gαo in ACh-bound S1, ACh-bound S2, and Ixo-bound (PDB: 6OIK) states. b, c Comparison of αN and α5 helices in three structures, the α5 helix is shown in both side and bottom views. d Cartoon representation of the active (PDB: 6OIK) and inactive (PDB: 3UON) structures of the M2R with TM6 and the position of Met3836.31 (red) highlighted. e HSQC spectra of Met3836.31 in ACh-bound (cyan), ACh-GoAGDP-bound (purple), and ACh-GoAapyrase-bound (green) states. f HSQC spectra of Met3836.31 in Ixo-bound (blue), Ixo-GoAGDP-bound (brown), and Ixo-GoAapyrase-bound (red) states. The apo-state spectrum of Met3836.31 is shown in gray as a reference. g Comparison of the HSQC spectra of Met3836.31 bound to ACh and Ixo along the process of GoA complex formation. The peak centers in ligand-bound spectra are shown as colored dots. h–j Alignment of the M1-G11 structure (PDB: 6OIJ) with the ACh-bound M2R-GoA S1 (h) and S2 (i) structures and the Ixo-bound M2R-GoA (PDB: 6OIK) structure (j). The different orientation between GoA and G11 is depicted with curved arrows. The clash between the extended TM5 helix with GoA is highlighted with dashed circle.

