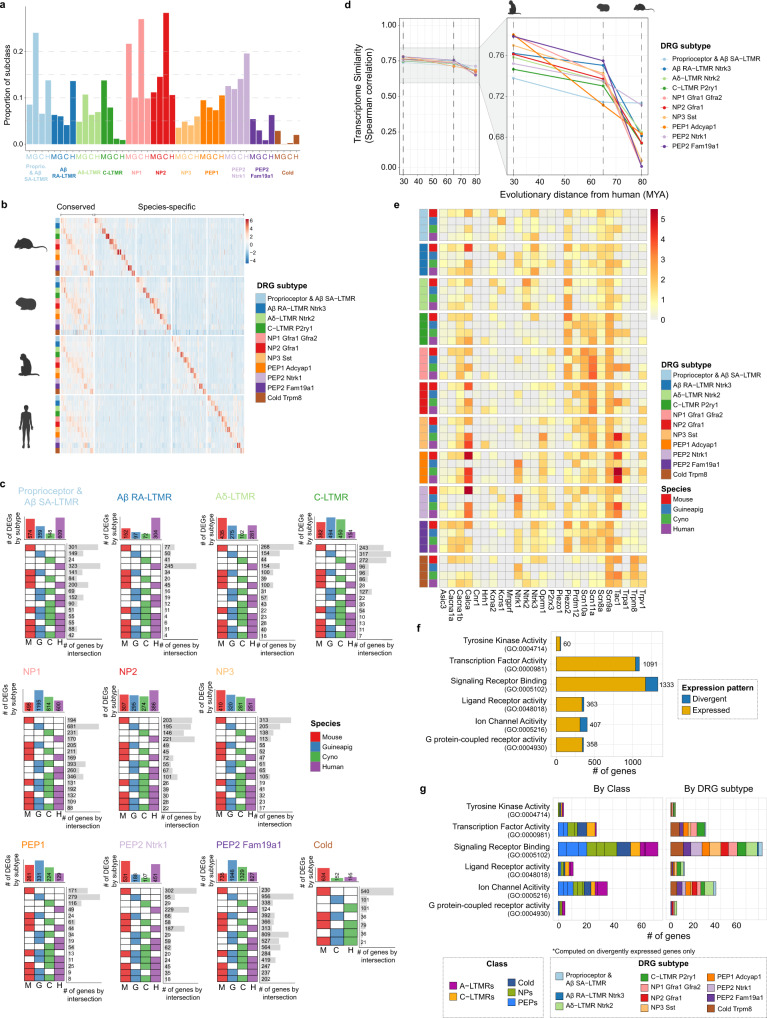
Fig. 4. Conserved and species-specific transcriptional programs in DRG sensory neurons.
a Relative DRG subtype proportions across all species (computed in lumbar levels only). b Heatmap of conserved genes and species-specific genes by DRG subtypes from panel (c). c Customized UpSet plot showing a number of conserved and species-specific genes across datasets for each of the major sensory neuron subtypes, as indicated above each plot. Total number of genes that are unique to one species (one colored box per row), or shared across multiple species (multiple colored boxes per row), are indicated to the right of each row. d Plot indicating evolutionary distance (x-axis; icons at top) and transcriptional correlation (y-axis) for each sensory neuron subtype (indicated by colors) between humans and other preclinical species. Correlation values are indicated by colored circles; the values across all species are connected with a solid line. e Heatmap indicating normalized expression levels of genes associated with pain perception in each neuronal subtype. f Number of genes with a divergent or non-divergent expression between mouse and human DRGs indicated by gene ontology(GO) annotation category. Numeric numbers on each bar represent the total number of expressed genes in a given GO category. g Number of divergently expressed genes between mouse and human samples from panel (f), colored by DRG class (left) or subtype (right). NP denotes non-peptidergic; PEP denotes peptidergic for (a–g). M denotes mouse, G denotes guinea pig, C denotes cynomolgus monkey, and H denotes human for (a–c). Species icons in b and d were created with BioRender.com.

