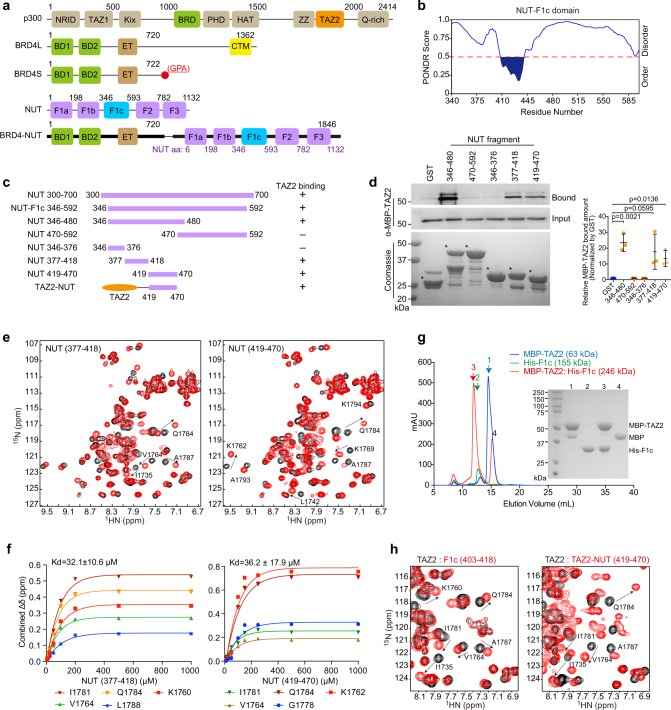
Fig. 1. NUT F1c region contains two TADs that bind to p300 TAZ2 domain.
a Schematic diagram showing protein domains of p300, BRD4 isoforms, NUT, and BRD4-NUT fusion protein. b Plot showing order/disorder prediction of the BRD4-NUT F1C region by the PONDR algorithm. c Various recombinant NUT protein constructs used in the binding assay. d GST or GST-NUT fragments were used to pull down MBP tagged p300 TAZ2 domain. Both NUT TAD1 (residues 377–418) and TAD2 (residues 419–470) sequences can equally bind to TAZ2 domain. The proteins were visualized using antibodies as indicated. Data represent mean +/− SEM (n = minimum of three independent experiments for each condition). p-values for each indicated comparison are two-tailed unpaired and derived from Student’s t-test without adjustment for multiple comparisons. e Overlays of NMR 1H-15N-HSQC spectra of the 15N-labeled TAZ2 domain in the free form (black) or in the presence of the NUT fragments as indicated (red). The TAZ2/NUT molar ratio is 1:3 (red). Peaks that exhibit significant chemical shift perturbations are marked with residue numbers. Arrows indicate chemical shift changes for individual peaks. f The HSQC binding analysis of TAZ2 domain with NUT fragments as indicated. The saturation curves were calculated using a single-site binding equilibrium model. g Size-exclusion chromatography reveals oligomeric forms of His-F1c (residues 346–592) and MBP-TAZ2/His-F1c mixture. The right panel shows SDS-PAGE analysis and silver staining of individual fractions. Reference proteins were also subjected to the same chromatographic treatment for comparison. The elution profiles are Red: MBP-TAZ2/His-F1c protein complex in the 1:1 mix ratio; blue: MBP-TAZ2; green: His-F1c with apparent molecular mass of 246, 63 and 155 kDa, respectively. The calculated molecular masses by SDS-PAGE of His-F1c, MBP and MBP-TAZ2 monomers are 30, 42 and 60 kDa, respectively. His-F1c assumes a 155-kDa oligomer comprised of 5 subunits of monomer (MW~30 kDa). Experiments were repeated at least twice. h Overlay of the HSQC spectra of the TAZ2 domain in the free form (black) and in the presence of the F1c peptide (red) (residues 403–418) (left) or TAZ2-NUT fusion protein (right).

