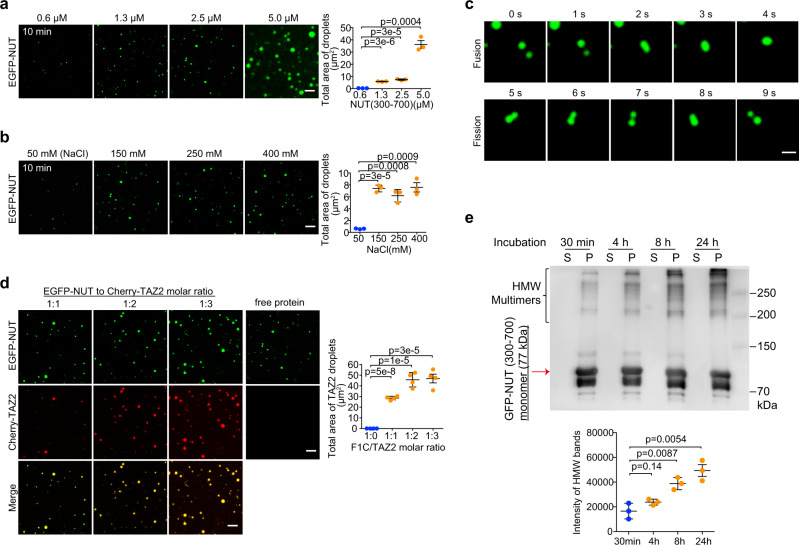
Fig. 3. NUT droplet formation is facilitated by its binding to p300 TAZ2.
a Fluorescence images showing liquid droplets of EGFP-NUT (residues 300–700) with increasing amounts of the protein as indicated. Histogram plots showing total area of droplets per field (36 × 36 μm). Scalar bars: 5 μm. Quantitative data (right) are shown as mean +/− S.D. (n = minimum of three independent samples for each condition). p-values for each indicated comparison are two-tailed unpaired and derived from Student’s t-test without adjustment for multiple comparisons. b Microscopic images depicting EGFP-NUT (residues 300–700, 2.5 μM) droplet formation at different salt concentrations as indicated. Scalar bars: 5 μm. Quantitative data (right) are shown as mean +/− S.D. (n = minimum of three independent samples for each condition). p-values for each indicated comparison are two-tailed unpaired and derived from Student’s t-test without adjustment for multiple comparisons. c Images showing fusion (top) or fission (bottom) of EGFP-NUT (residues 300–700, 2.5 μM) droplets in a time course as indicated. Scalar bars: 1 μm. Experiments were repeated at least twice. d Fluorescence images showing liquid droplets of EGFP-NUT (residues 300–700, 2.5 μM) with addition of Cherry-TAZ2 as indicated. Histogram plots showing total droplet areas per field (36 × 36 μm) in different NUT to TAZ2 molar ratio. Three fields are quantified. Scalar bars: 5 μm. Quantitative data are shown as mean +/− S.D. (n = minimum of four independent samples for each condition). p-values for each indicated comparison are two-tailed unpaired and derived from Student’s t-test without adjustment for multiple comparisons. e Supernatant (S) and pelleted (P) fractions from droplet spin down experiments were run in western blots to assess the time-dependent (0–24 h of phase separation) formation of heat-, reducing- and SDS-stable EGFP-NUT/Cherry-TAZ2 oligomers. Note that some high molecular weight protein complexes (HMW multimers) appeared shortly after addition of Cherry-TAZ2. Data represent mean +/− SEM from three independent experiments. p-values for each indicated comparison are two-tailed unpaired and derived from Student’s t-test without adjustment for multiple comparisons.

