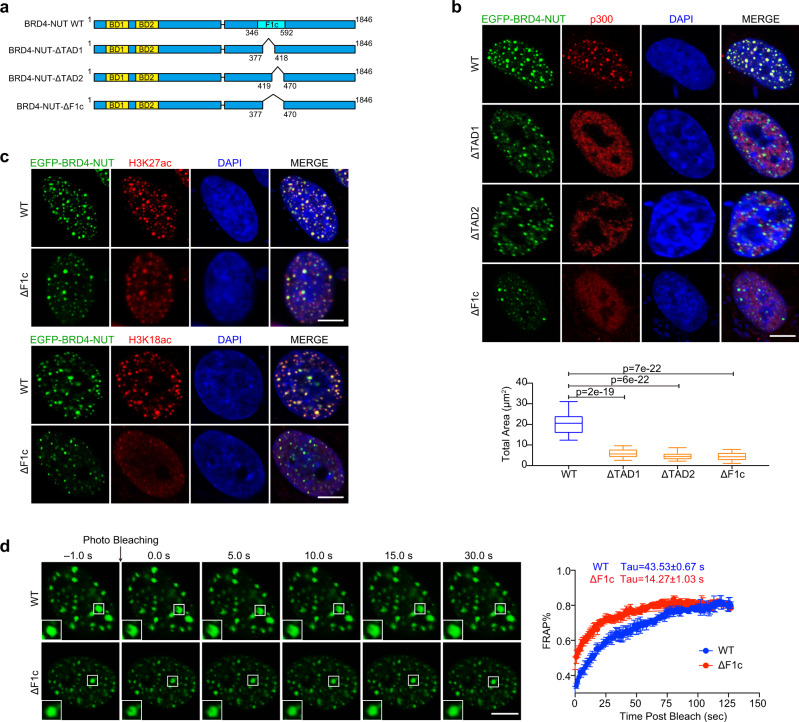
Fig. 4. BRD4-NUT puncta are co-localized with p300.
a Schematic representations showing domain architecture of BRD4-NUT-WT, -ΔF1c, -ΔTAD1, or -ΔTAD2 deletion mutants. b Microscopic images showing EGFP-BRD4-NUT-WT, -ΔF1c, -ΔTAD1, or -ΔTAD2 mutant puncta in colocalization with p300 in LO2 cell nuclei. Endogenous p300 was visualized using the p300 antibody. Box plots represent the lowest, lower quartile, median, upper quartile, and highest observations of puncta areas in cells expressed either with EGFP-BRD4-NUT-WT or indicated deletion mutants (n = minimum of 30 cells for each condition). Scalar bars: 5 μm. Two tailed unpaired Student’s t-test without adjustment for multiple comparisons. c EGFP-BRD4-NUT-WT or EGFP-BRD4-NUT-ΔF1c in LO2 cell nuclei colocalizes with H3K27ac or H3K18ac. Endogenous acetylation marks were visualized using H3K27ac or H3K18ac antibody. Scalar bars: 5 μm (n = minimum of nine cells for each condition). d FRAP analysis of EGFP-BRD4-NUT-WT or EGFP-BRD4-NUT-ΔF1c puncta in LO2 cells. Representative images of FRAP experiment are shown as indicated time, Quantitative FRAP data are shown as mean +/− S.D. (n = minimum of three independent samples for each condition). Scalar bars: 5 μm.

