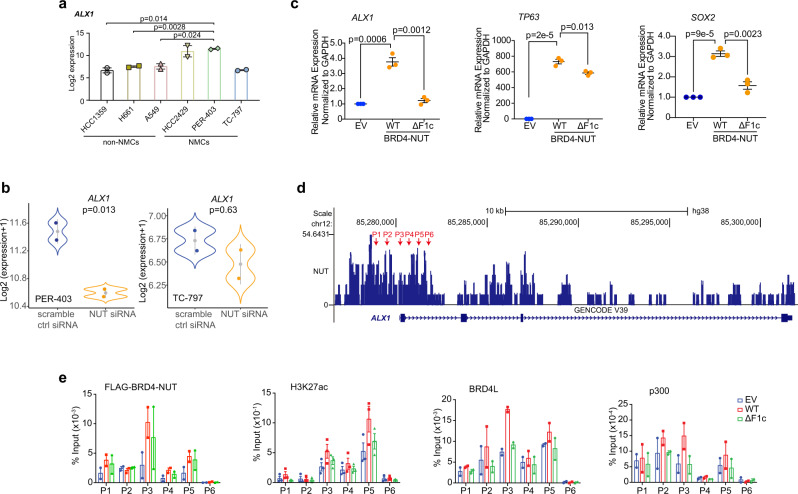
Fig. 6. BRD4-NUT upregulates ALX1 transcription and promotes EMT.
a ALX1 mRNA was significantly overexpressed in NC cells as compared to matched non-NC cells with available RNA-seq datasets (GSE14925, GSE109821, GSE199299, GSE18668) of HCC2429 and PER-403 (NC, lung), TC-797 (NC, thymus), and HCC1359, H661, and A549 (non-NC, lung). Data represent mean +/− SEM from two independent datasets for each cell-line. p-values are derived from two-tailed unpaired Student t-testing analysis without adjustment for multiple comparisons. b RNA-seq analysis of ALX1 gene expressions in PER-403 and TC-797 (GSE18668) cells transfected with siRNA as indicated. Data represent mean +/− SEM from two independent datasets. The blue and orange color dots represent dataset values and gray dots indicate median values. Two-sided p-values for each indicated comparison are derived from the R software loaded with Limma package. c Relative mRNA levels of selected genes were measured by qPCR and normalized to the GAPDH mRNA level following transfection of EGFP-BRD4-NUT-WT or EGFP-BRD4-NUT-ΔF1c in HEK293T cells. Values represent the average of three independent experiments with error bars indicating as mean +/− SEM (n = minimum of three independent experiments for each condition). Two-tailed unpaired Student’s t-test without adjustment for multiple comparisons. d BRD4-NUT enrichment at the promoter site of ALX1 in PER-403 cells, as shown by ChIP-seq dataset from the Gene Expression Omnibus database (GSE70870). Red arrows indicate the promoter regions of ALX1 gene selected for the ChIP-qPCR assay. e ChIP analysis for enrichment of Flag-BRD4-NUT (-WT or -ΔF1c), BRD4L, H3K27ac and p300 at the ALX1 promoter regions of HEK293T cells, as indicated in Fig. 5d. Data represent mean +/− SEM from minimum two independent experiments.

