Figure 1.
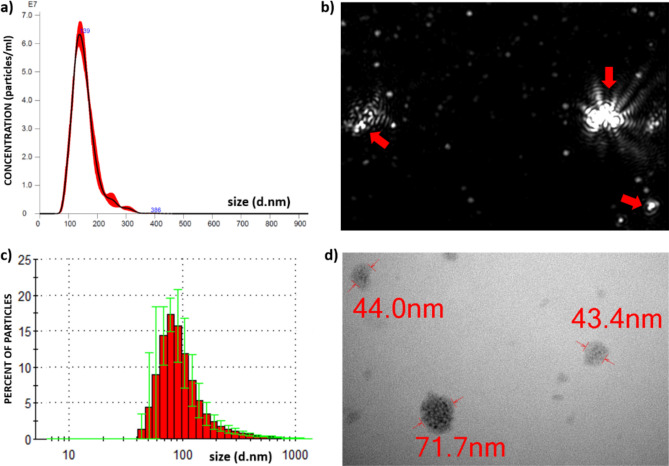
Slug EXs characterisation. (a) Representative histogram illustrating the nanoparticle size distribution of slug EXs in liquid suspension as determined by Nanoparticle tracking analysis. (b) Visualisation of the individual EXs (single white dots of various sizes) and their aggregates (red arrows) from a video recording of the particles moving under Brownian motion. (c) Representative histogram illustrating the size distribution of slug EXs as determined by Dynamic light scattering analysis. (d) Transmission electron micrographs of slug EXs showing vesicular structures.

