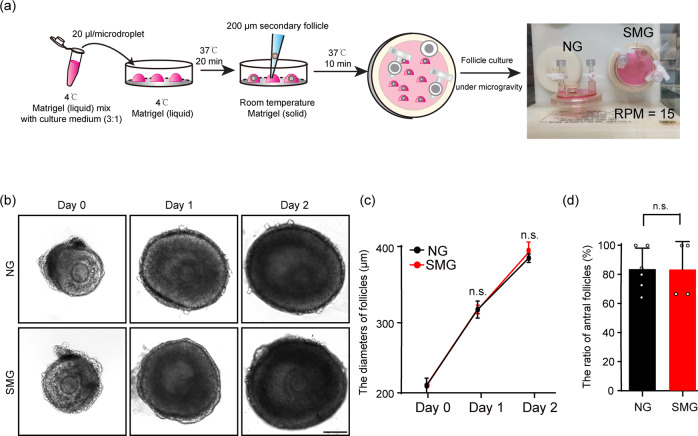
Fig. 1. Tracing the growth of ovarian follicles in a 3D culture system under simulated microgravity condition.
a The flowchart of the 3D ovarian follicle culture in RCCS. The follicles were seeded into a Matrigel droplet to support their growth. b, c Tracing the growth of ovarian follicles in the NG and the SMG groups in vitro (b), showing comparable developmental dynamics of follicles in the SMG groups (n = 48) compared to that in the NG group (n = 60) (c). Day 0: p value = 0.13. Day 1: p value = 0.43. Day 2: p value = 0.076. Scale bars: 100 μm. d The ratio of antral formation in the cultured follicles under different conditions, showing no significant changes of antral forming proportions of cultured follicles in the SMG group (n = 65) compared to that in the NG group (n = 73). p value = 0.98. Representative images are shown. Data are presented as the mean ± SD. Data were analyzed by two-tailed unpaired Student’s t-test and n.s. P ≥ 0.05.

