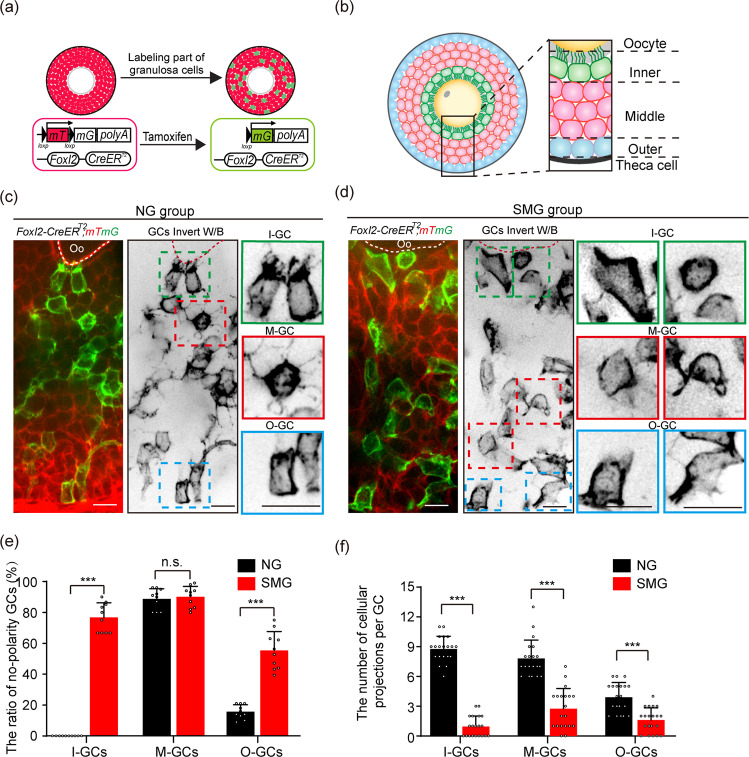
Fig. 3. SMG treatment disrupted GC polarity and the formation of communicating structures in GCs.
a Illustration of the strategy to induce labeling of the GCs in Foxl2-CreERT2;mTmG follicles. With a low dosage of tamoxifen treatment, membrane-localized red fluorescent protein (mT) switches to green-fluorescent protein (mG) in GCs of Foxl2-CreERT2;mTmG follicles, which allows for imaging of the cell outline of GCs under high-resolution imaging system. b The standard to separate the GCs in growing follicles. The inner layer of GCs was defined as the layer which directly connected to the oocyte by GC-TZPs (I-GCs, green); the middle layers of GCs was distributed in the middle multilayers position of follicle (M-GCs, pink); The outer layer of GCs was defined as the layer adjacent to the theca cells (O-GCs, blue). c Images of Foxl2-CreERT2;mTmG follicles showing the morphology of GCs in different regions in the NG group. I-GCs (green box) exhibited cuboidal shape with tree root-like GC-TZPs oriented toward the oocyte. Rounded M-GCs (red box) exhibited extended random cellular projections. Similar shaped cell with I-GCs, cuboidal O-GCs (blue box) extended a few cellular projections toward to M-GCs. Scale bars, 15 μm. d In the SMG group, both the polarity and the communicating structures on GCs were abnormal, showing a failure of GC-TZPs on I-GCs (green boxes), and dramatically reduced cellular projections on M-GCs (red boxes) and O-GCs (blue boxes). I-GCs and O-GCs exhibited a loss of polarity shape under SMG condition compared to that in the NG group. Scale bars, 15 μm. The cartoon model as shown in Supplementary Fig. 3. e Statistical analysis of GCs showing a significant increase in the proportion of non-polarity in I-GCs and O-GCs under SMG conditions (n = 10) compared to the NG group (n = 10). I-GCs: p value = 0.0000000010, M-GCs: p value = 0.64, O-GCs: p value = 0.00000082. f Loss of cellular projections in all layers of GCs under SMG conditions (n = 20) compared to that in NG conditions (n = 20). I-GCs: p value = 0.00000000000000000000064, M-GCs: p value = 0.00000000059, O-GCs: p value = 0.0000051. Representative images are shown. Data are presented as the mean ± SD. Data were analyzed by two-tailed unpaired Student’s t-test and n.s. P ≥ 0.05, ***P < 0.001. The colors were inverted to black/white (b/w) to highlight GCs in (c, d).

