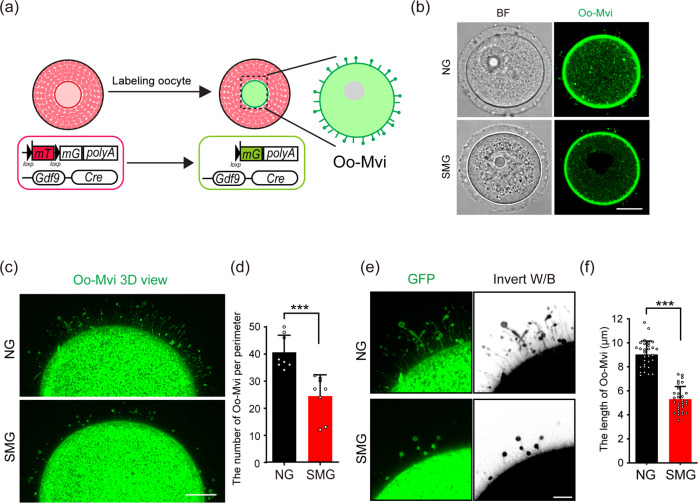
Fig. 4. SMG treatment decreased the formation of Oo-Mvi in cultured follicles.
a Illustration of the strategy to label the Oo-Mvi by Gdf9-Cre;mTmG mouse model. The membrane-localized red fluorescent protein (mT) switches to green-fluorescent protein (mG) in oocytes of Gdf9-Cre;mTmG mouse to label oocyte membrane morphology. b Images of Gdf9-Cre;mTmG oocytes, showing the mushroom-like Oo-Mvi with vesicle tips distributed in the zona pellucida of oocytes in both the SMG and the NG groups. Scale bars, 30 μm. c 3D high-resolution images showing a decreased density of Oo-Mvi on the oocytes’ surface under SMG. Scale bars, 10 μm. d Numbers of Oo-Mvi reduced in SMG oocytes (n = 8) compared to that in NG (n = 8), showing a significantly reduced number of Oo-Mvi on oocytes in follicles after SMG treatment. p value = 0.00052. e High magnification showing that the length of Oo-Mvi in the SMG group was shorter than that in the NG group. Scale bars, 5 μm. f Quantification of the length of Oo-Mvi confirmed a dramatic decrease in the SMG group (n = 30) compared to that in the NG group (n = 30). p value = 0.00000000000000000052. The colors were inverted to black/white (b/w) to highlight Oo-Mvi in (e). Representative images are shown. Data is presented as the mean ± SD. Data were analyzed by two-tailed unpaired Student’s t-test and ***P < 0.001.

