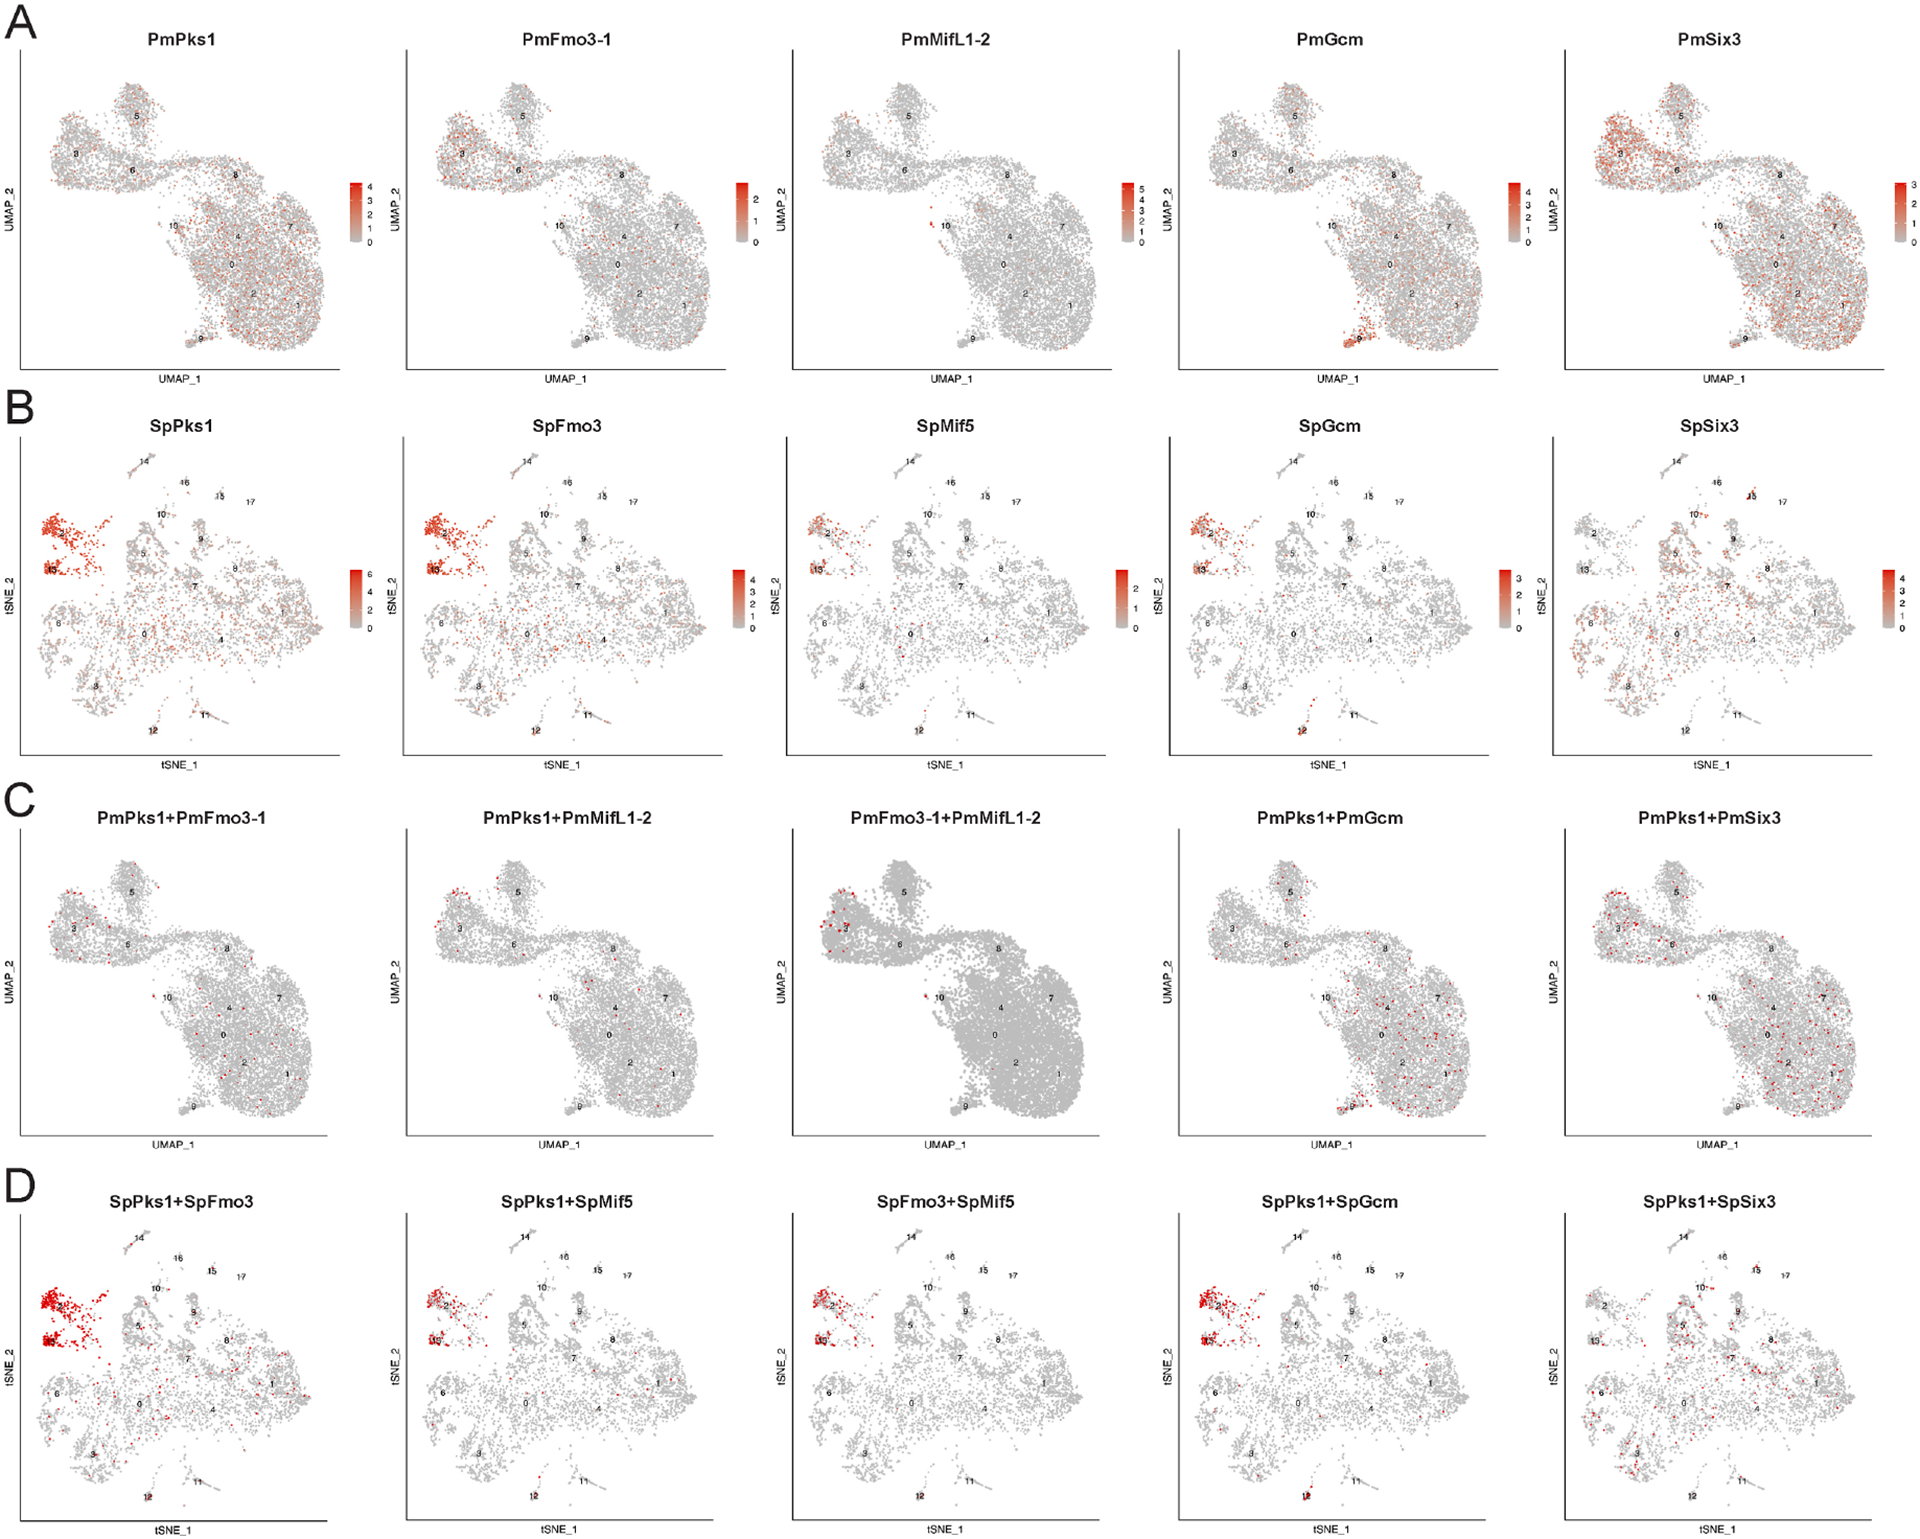
Figure 7. Comparative scRNA-seq analysis of sea star and sea urchin gastrulae.

Cluster annotations are shown in Supplementary Table S1 for sea star data [63] and Supplementary Table S2 for sea urchin data [16]. A-B. Feature plots for selected transcripts for sea star (A) and sea urchin (B) at gastrular stages. C-D. Coexpression analysis highlights cells double positive for indicated transcripts in red for sea star (C) and sea urchin (D).
