Fig. 2.
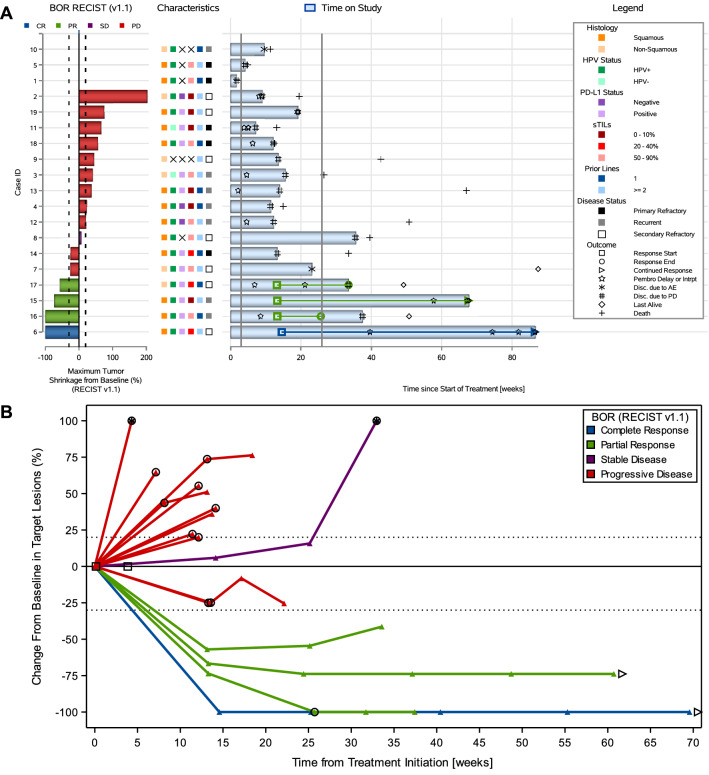
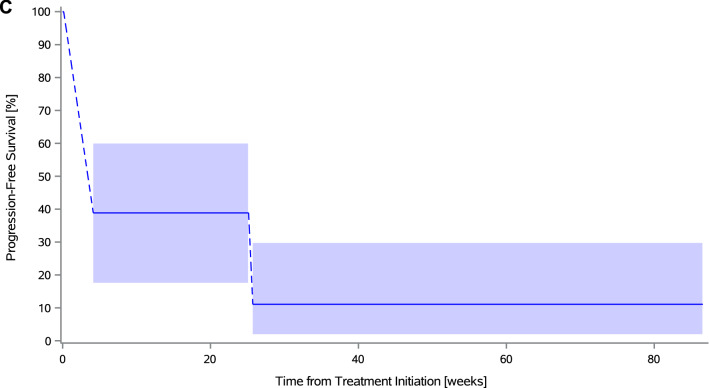
Antitumor activity to study treatment in the cervical cohort. A Combined waterfall and swimmer plot. Each row (i.e., response bar + characteristics + swimmer lane) corresponds to one patient. Waterfall plot showing best percentage change from baseline in the sum of diameters of the target lesions; best overall response is indicated by color coding of bars and includes assessment of target, nontarget, and new lesions. The dotted lines at − 30% and + 20% indicate thresholds for partial response and progressive disease (PD), respectively, per Response Evaluation Criteria in Solid Tumors, version 1.1 (RECIST v1.1). Swimmer plot (event chart) for tumor response (response category indicated by color coding) and progressive disease per RECIST v1.1, safety, time on study, and death. The solid lines at week 3 and week 26 indicate the first pembrolizumab dose and the timing of the primary endpoint, respectively. B Spider plot. Dynamics of response according to best response (per RECIST v1.1). Circle indicates patients with new lesions or growth in non-target lesions (i.e., PD, even with a less than 20% change in the target lesions). Arrow indicates patients with an ongoing response at time of data cutoff. Square indicates patients with clinical progression (before an imaging scan was acquired). Patients with > 100% increase were truncated at 100% (indicated with a star). C Interval-censored progression-free survival per immune-related response criteria. AE adverse event, BOR best overall response, CR complete response, HPV human papillomavirus, PD progressive disease, PD-L1 programmed death ligand-1, PR partial response, RECIST v1.1 Response Evaluation Criteria in Solid Tumors, version 1.1, SD stable disease, sTILs stromal tumor-infiltrating lymphocytes


