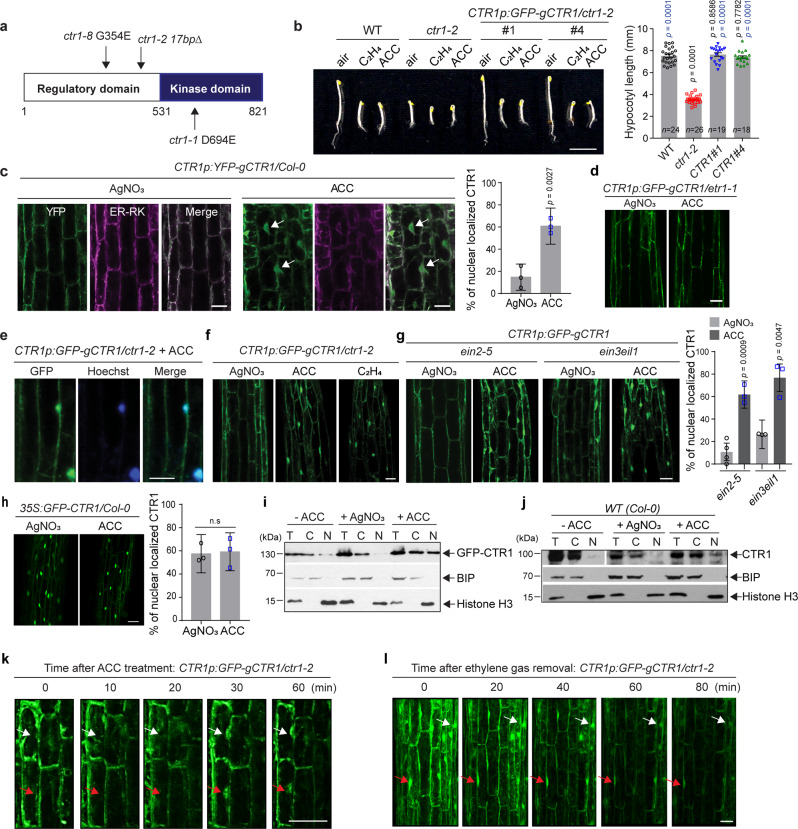
Fig. 1. Ethylene-activated CTR1 translocation to the nucleus does not require EIN2 and EIN3.
a Diagram of the CTR1 protein and the positions of ctr1 mutant alleles. b The GFP-fused wild-type genomic CTR1 fragment fully rescues ctr1-2 and confers an ethylene response. Seedlings were grown for 3 d in the dark with or without ACC or ethylene. The graph represents the quantification of hypocotyl lengths of seedlings grown on MS without ACC. MS, Murashige and Skoog medium. Significance was determined by one-way ANOVA with Dunnett’s multiple comparisons test to compare the results to the WT (black) and ctr1-2 (blue) controls. Error bars, SE. Scale bar, 5 mm. c YFP-CTR1 co-localizes with ER-RK and translocates into the nucleus in the presence of ACC. The areas below the hook and above the elongation zone were imaged. ER-RK62, an RFP-fused ER marker. Arrows indicate nuclear-localized YFP-CTR1. The graph represents the ratio of nuclear-localized CTR1 in dark-grown seedlings. Error bars, SE (n = 3 seedlings). d GFP-CTR1 does not translocate into the nucleus in etr1-1 mutant. e GFP-CTR1 fluorescence overlaps with Hoechst nuclear staining under ACC treatment. f Ethylene and ACC activate CTR1 nuclear translocation. g Seedlings expressing GFP-CTR1 in ein2-5 or ein3eil1 mutants were grown on MS medium with or without AgNO3 or treated with ACC for 2 h. Error bars, SE (n = 3–4 seedlings). h Overexpression of CTR1 from 35S promoter leads to nuclear localization of CTR1 in the presence of silver nitrate. Error bars, SE (n = 3 seedlings). i–j Total protein extract (T) of seedlings treated with or without ACC (200 μM) or grown on media with silver nitrate (100 μM) was fractionated into nuclear (N) and cytoplasmic (C) fractions, followed by immunoblotting with anti-GFP, -BIP, and -CTR1, and anti-Histone H3 antibodies. k Time-lapse image series of hypocotyl cells expressing GFP-CTR1 in 3-d-old etiolated CTR1p:GFP-gCTR1/ctr1-2 seedlings after exposure to 200 µM ACC. l GFP-CTR1 fluorescence decreased after ethylene gas removal. CTR1p:GFP-gCTR1/ctr1-2 seedlings were pretreated with 10 ppm ethylene gas and imaged different time points after the ethylene removal. All scale bars represent 50 μm, except the scale bar in (b). The presented images at each time point (k–l) are merged Z-stack images that combine 10 successive Z-stack images with 2 µm intervals. All imaging was repeated at least of three times with similar results. Two-tailed Student’s t test was performed to determine statistical significance for (c), (g), and (h). n. s, statistically not significant.

