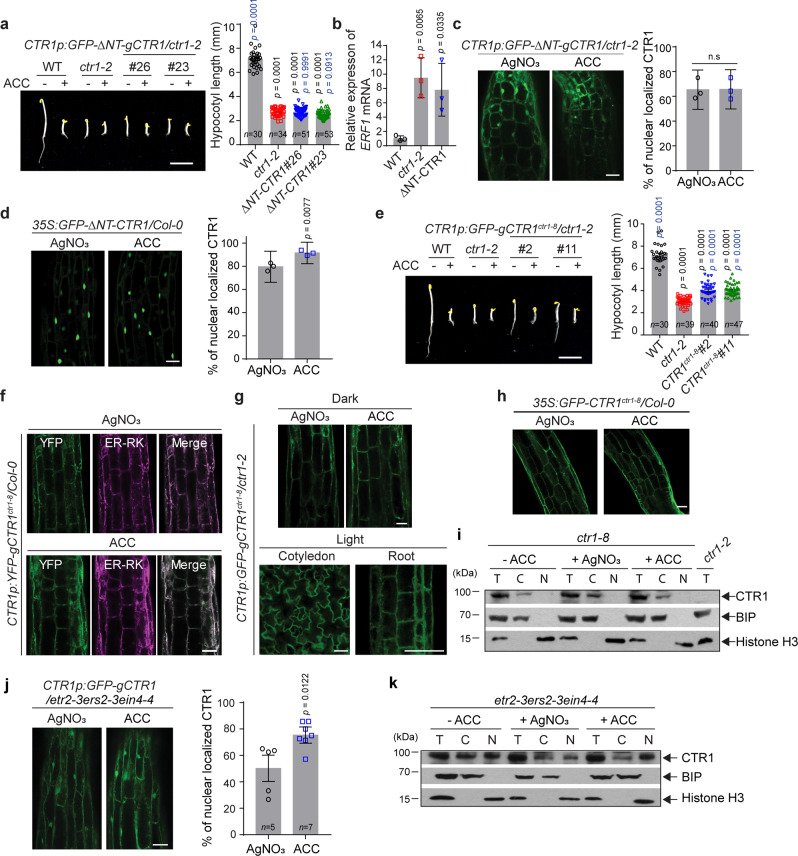
Fig. 2. The N-terminus of CTR1 inhibits ACC-induced CTR1 nuclear movement.
a Seedlings were grown on MS medium with or without 10 μM ACC for 3 d and photographed. The graph shows quantification of the hypocotyl lengths of seedlings grown on MS without ACC. Scale bar, 5 mm. Significance was determined by one-way ANOVA with Dunnett’s multiple comparisons test to compare the results to the WT (black) and ctr1-2 (blue) controls. Error bars, SE. b Quantitative gene expression analysis of ethylene-responsive ERF1 in ctr1-2 and CTR1p:GFP-ΔNT-gCTR1 seedlings. Expression was normalized to an Actin control and is presented relative to the WT control. Error bars, SD (n = 3 biological replicates). c Constitutive nuclear localization of GFP-ΔNT-CTR1 expressed from the native promoter in the hypocotyls of dark-grown seedlings. The graph represents the ratio of nuclear-localized CTR1 in dark-grown seedlings treated with ACC or AgNO3. Error bars, SE (n = 3 seedlings). d Constitutive nuclear localization of GFP-ΔNT-CTR1 expressed from the CaMV 35S promoter in 3-d-old dark-grown. The graph represents the ratio of nuclear-localized CTR1 in dark-grown seedlings treated with ACC or AgNO3. Error bars, SE (n = 3 seedlings). e Seedlings expressing GFP-CTR1ctr1-8 from the native promoter were grown on MS medium with or without 10 μM ACC for 3 d and photographed. The graph represents the quantification of hypocotyl lengths of seedlings grown on MS without ACC. Scale bar, 5 mm. One-way ANOVA with Dunnett’s multiple comparisons test to compare the results to the WT (black) and ctr1-2 (blue) controls. Error bars, SE. f Seedlings co-expressing YFP-CTR1-8 and ER-RK were grown in the dark and used to visualize co-localization. g–h GFP-CTR1-8 does not translocate into the nucleus in both dark and light conditions. i Fractionation analysis of ctr1-8 mutant seedlings treated with or without ACC and silver nitrate. j Constitutive nuclear localization of GFP-CTR1 in the etr2-3ers2-3ein4-4 mutant background in the dark-grown seedlings. Error bars, SE. k Fractionation analysis of etr2-3ers2-3ein4-4 mutant seedlings treated with or without ACC and silver nitrate. Scale bars in (c, d, f, g, h, j) represent 50 μm. All imaging was repeated at least of three times with similar results. Two-tailed Student’s t test was performed to determine statistical significance for (b, c, d, j). n.s, statistically not significant.

