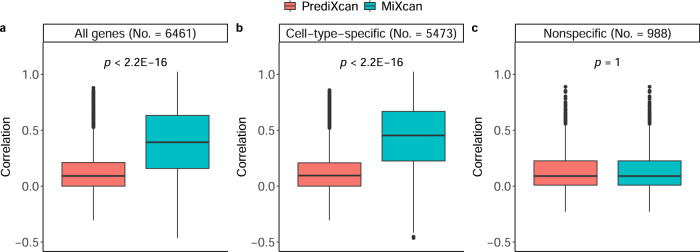
Fig. 2. Validation of tissue-level GReX predictions in an independent bulk mammary tissue dataset.
The correlation of tissue-level GReX predictions using MiXcan or PrediXcan with measured gene expression levels in adjacent normal mammary tissue samples from 103 European ancestry women with breast cancer in TCGA were computed for (a) all 6461 genes with MiXcan and PrediXcan models trained using mammary tissue samples from 125 European ancestry women in GTEx, (b) 5473 genes with cell-type-specific MiXcan models, and (c) 988 genes with nonspecific MiXcan models. Differences between the correlations for MiXcan and PrediXcan were compared using the two-sided Wilcoxon signed-rank test. Boxplot bounds show the lower, median, and upper quartiles; whisker lengths are 1.5 times the interquartile range; and points beyond the whiskers are outliers. Source data are provided as a Source Data file.

