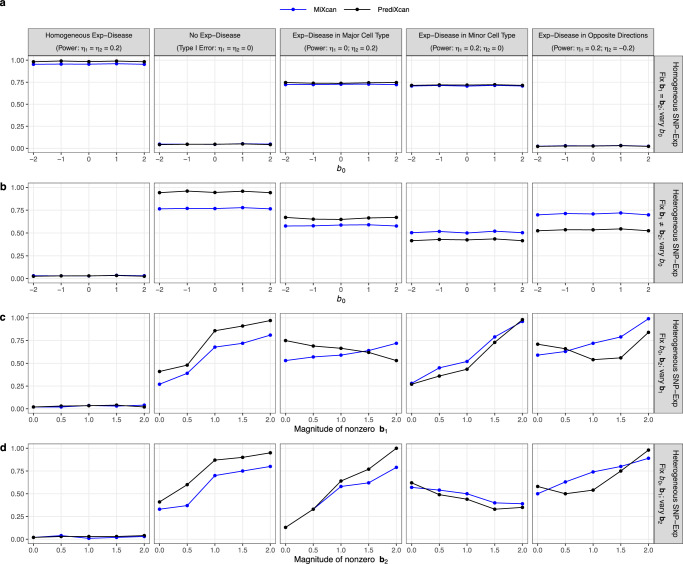
Fig. 4. Simulation studies to evaluate the type I error and power of MiXcan and PrediXcan to detect associations of GReX with disease at the tissue level.
Bulk tissue samples (N = 300) for training GReX prediction models and independent studies (N = 3000) for testing disease associations were simulated under a range of realistic data scenarios. Gene expression levels were modeled by u = b0 + b1x + eu in the minor cell type, v = b2x + ev in the major cell type, and y = πu + (1 − π)v at the tissue level, where π denotes the minor cell-type proportion, b0 denotes the mean difference of the gene expression levels in the two cell types, and b1 and b2 denote the weights for the association of SNPs X with gene expression levels in the minor and major cell types, respectively. The disease D was modeled by logit P(D = 1) = η0 + η1u + η2v where η1 and η2 denote the associations of the gene expression levels with disease in the two cell types, respectively. (a) Homogeneous SNP-Exp associations (b1 = b2) in the two cell types, varying the mean difference in gene expression levels between the two cell types (b0). Heterogeneous SNP-Exp associations (b1 ≠ b2) in the two cell types, varying the: (b) mean difference in gene expression levels between the two cell types (b0); (c) magnitude of the SNP-Exp association in the minor cell type (b1); and (d) magnitude of the SNP-Exp association in the major cell type (b2). Source data are provided as a Source Data file.

