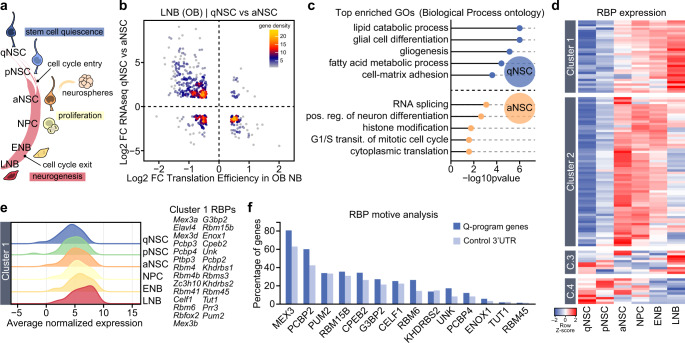
Fig. 1. Post-transcriptional control of a NSC stemness/gliogenic signature during neural lineage differentiation.
a Schematic drawing representing the cell populations in the adult SEZ neurogenic lineage (qNSC: quiescent neural stem cells; pNSC: primed NSC; aNSC: activated NSC; NPC: neural progenitor cell; ENB: early neuroblast; LNB: late neuroblast). Adult NSC can be cultured and expanded in vitro as clonal aggregates, neurospheres. Cell cycle entry and exit points along the lineage are highlighted. b Scatterplot comparing differential expression (DE) data from isolated qNSC vs. aNSC populations12 with translation efficiency data from OB NBs17. c Gene Ontology (GO) enrichment analysis of genes that define the qNSC and aNSC signature and are subjected to translational repression during lineage differentiation. d Heatmap showing the expression pattern of different families of RNA-binding proteins (RBPs) in isolated SEZ populations12. e Ridgeplot showing average expression of Cluster 1 RBPs in SEZ populations. f Cluster 1 RBP motive analysis in qNSC-signature genes that are translationally repressed during neuroblast differentiation. Graph shows the percentage of 3’UTR sequences that include the RBP motive compared to a set control 3’UTR.

