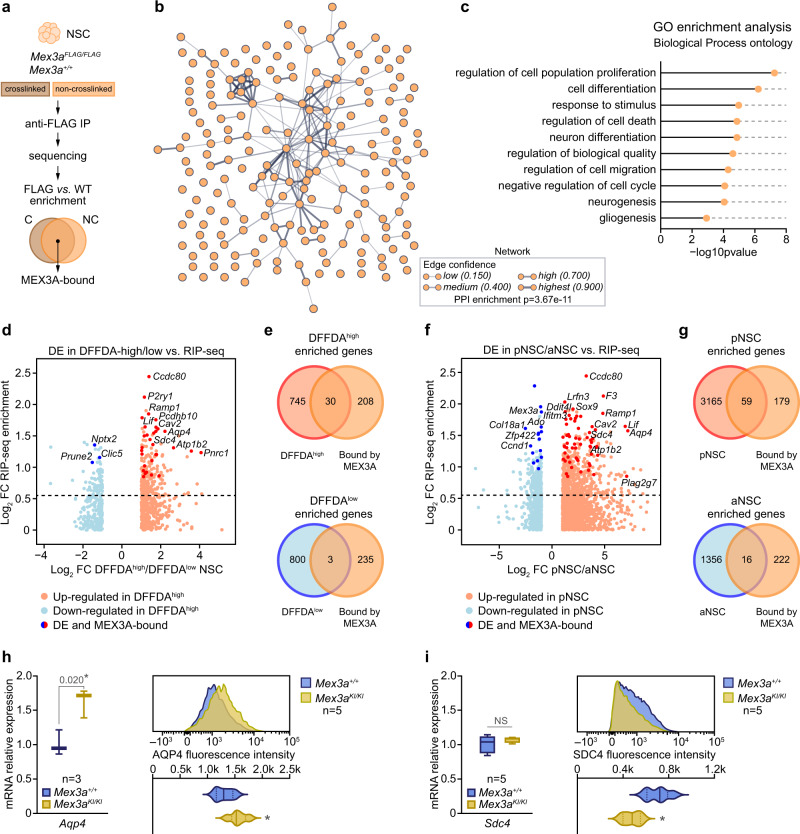
Fig. 3. The MEX3A regulon reveals a stemness/gliogenic program associated with neurogenic lineage quality.
a MEX3A RNA-immunoprecipitation (RIP) diagram. IP: immunoprecipitation; C: crosslinked samples; NC: non-crosslinked samples. b Protein-protein interaction network generated from MEX3A-bound coding RNAs (STRING PPI enrichment p-value = 3.67 × 10⁻¹¹). Line thickness indicates strength and confidence of the connection (https://string-db.org/). See Supplementary Fig. 3c and Supplementary Data 1 for detailed target lists. c Representative Gene Ontology (GO, Biological Process) terms enriched in the subset of MEX3A-bound coding RNAs (see Supplementary Data 2 for a complete GO list). Significance values are reported after FDR correction. d Scatterplot comparing differential expression (DE) data from DFFDAhigh vs. DFFDAlow populations12 with MEX3A RIP-seq enrichment (FDR < 0.05). Red dots represent up-regulated, and blue dots down-regulated genes in DFFDAhigh cells. Dark red and blue dots label DE genes also bound by MEX3A. e Overlap between MEX3A-bound genes (orange) and genes enriched in DFFDAhigh (red, top) and DFFDAlow (blue, bottom) populations. DFFDAhigh and MEX3A-bound genes show more overlap than expected (p-value = 8.5 × 10⁻⁸, by hypergeometric test). f DE data from isolated pNSC vs. aNSC populations12 with MEX3A RIP-seq enrichment data (FDR < 0.05). Red dots represent up-regulated, and blue dots down-regulated genes in pNSCs. Dark red and blue dots label DE genes also bound by MEX3A. g Overlap between MEX3A-bound genes (orange) and genes enriched in pNSCs (red, top) and aNSCs (blue, bottom). pNSC and MEX3A-bound genes show more overlap than expected (p-value=0.003, by hypergeometric test). Quantification of Aqp4 (h) and Sdc4 (i) gene expression by RT-qPCR in Mex3a+/+ and Mex3aKI/KI NSCs (left panels) (*p-value < 0.05 and NS = 0.317 by unpaired two-tailed Student’s t-test). AQP4 (h) and SDC4 (i) protein levels (median fluorescence intensity) by FACS in wild-type and KI homozygous NSC cultures (right panels) (p-values: AQP4 = 0.032, SDC4 = 0.011, by unpaired two-tailed Student’s t-test). Box plots show median± interquartile range and whiskers define minimum to maximum. Exact p-values and the number of biologically independent samples used are indicated. Source data are provided as a Source Data file.

