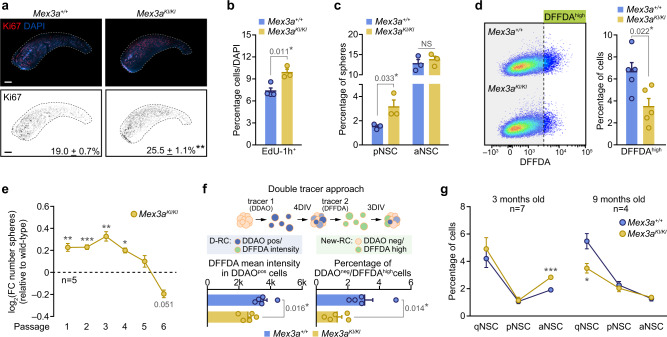
Fig. 4. MEX3A maintains the balance between cell state transitions and stemness in NSC.
a Immunohistochemistry for Ki67 (red) in Mex3a+/+ and Mex3aKI/KI SEZ wholemount preparations (top panels). Binary images of Ki67 (black) for both genotypes and quantification of the percentage of Ki67+ cells in coronal sections of the SEZ (n = 4, p-value = 0.003) (bottom panels). b Quantification of the percentage of cells that incorporated EdU 1 h prior to sacrifice (EdU+-1h) in the SEZ of wild-type and MEX3A mutant mice. c Quantification of the percentage of neurospheres originated from isolated wild-type and MEX3A-deficient pNSC and aNSC (NS = 0.502). d Representative FACS plots of DFFDA staining in wild-type and KI homozygous cultures (left panel). Quantification of the percentage of DFFDAhigh cells in Mex3a+/+ and Mex3aKI/KI NSC cultures (right panel). e Self-renewal assay in wild-type and MEX3A-deficient NSC cultures. Data is represented as the log2 of the fold-change in the number of spheres relative to wild-type for each passage (dashed line) (p-value P1 = 0.003, P2 = 0.0003, P3 = 0.001, P4 = 0.011, P5 = 0.208, P6 = 0.051). f Schematic representation of the strategy using two sequential fluorescent tracers; D-RC: double retaining cell, New-RC: new retaining cell (top panel). Quantification of DFFDA intensity in DDAOpos cells (left). Quantification of the percentage of newly generated semi-quiescent DDAOneg/DFFDAhigh cells (right). g Quantification of the percentage of NSC populations by FACS in 3-months-old (p-value qNSC = 0.502, pNSC = 0.887, aNSC = 0.0001) and 9 months-old (p-value qNSC = 0.025, pNSC = 0.567, aNSC = 0.553) Mex3a+/+ and Mex3aKI/KI mice. Graphs represent mean values and error bars show SEM. Exact p-values and the number of biologically independent samples (represented as dots) used are indicated in the graphs. *p-value < 0.05, **p-value < 0.01, ***p-value < 0.001 by unpaired two-tailed Student’s t-test. Source data are provided as a Source Data file. Scale bars: a, 500 μm.

