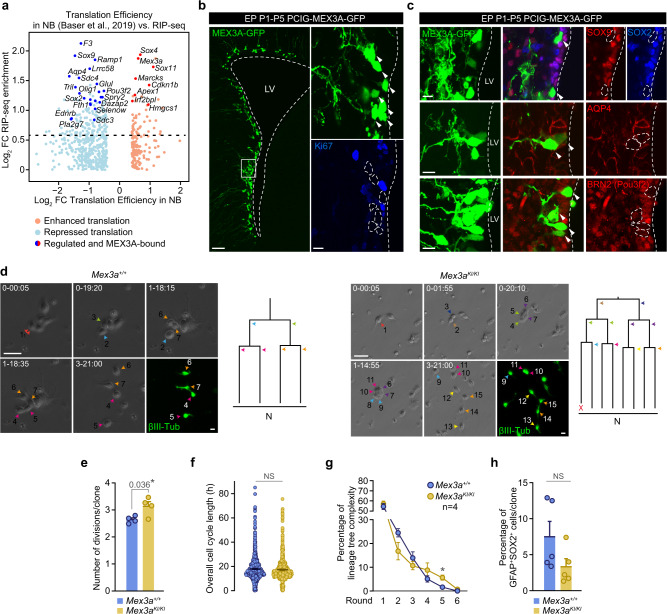
Fig. 5. Dysregulation of the MEX3A targetome at the onset of differentiation leads to hyperproliferation.
a Scatterplot comparing MEX3A RIP-seq enrichment data with translation efficiency data from SEZ and OB NBs17. Red dots represent genes with enhanced translation whereas blue dots represent genes with repressed translation. Dark red and blue dots label translationally regulated genes that are also bound by MEX3A. Four additional genes bound by MEX3A (Apoe, Mmp14, Tpt1 and Zfp219) showed uncoupled translation in NBs but differed between SEZ and OB, so they are not shown in the plot. b MEX3A-GFP signal (green) in the lateral ventricle of P5 mice 4 days after postnatal day 1 (P1) electroporation (EP) with PCIG-MEX3A-GFP (left). Ki67 (blue) expression in MEX3A-GFP+ electroporated cells (right). c Immunohistochemistry showing protein downregulation of MEX3A targets Sox9 (red), Sox2 (blue), Aqp4 (red) and Pou3f2 (BRN2, red) after overexpression of MEX3A-GFP. d Representative phase contrast images of Mex3a+/+ and Mex3aKI/KI individual clones obtained by video time-lapse microscopy at different points (day-hour:minute) (left). Immunostaining for ßIII-tubulin (green) at the endpoint shows postmitotic cells with characteristic neuroblast morphology. Lineage trees derived from the clones shown in the pictures (right). Colored arrowheads indicate each division. X indicates cell death. e Quantification of the number of divisions per clone in Mex3a+/+ and Mex3aKI/KI SEZ preparations (n = 4 mice). f Quantification of the overall cell cycle length (h) (NS = 0.184). g Percentage of clones that did undergo 1-to-6 rounds of divisions indicating lineage complexity of wildtype and MEX3A-deficient trees (*p-value = 0.032). h Percentage of GFAP+SOX2+ cells per clone in these trees (NS = 0.102). DAPI (blue) was used to counterstain nuclei. Arrowheads indicate positive cells. White boxes localize high-magnification inserts. Dashed lines mark the lateral ventricle (LV) and contour the nuclei of MEX3A-GFP+ cells. Graphs represent mean values and error bars show SEM. Exact p-values and the number of biologically independent samples (represented as dots) used are indicated in the graphs. *p-value < 0.05, by unpaired two-tailed Student’s t-test. Source data are provided as a Source Data file. Scale bars: b 100 μm (insert, 15 μm); b and c, 15 μm; d, 30 μm.

