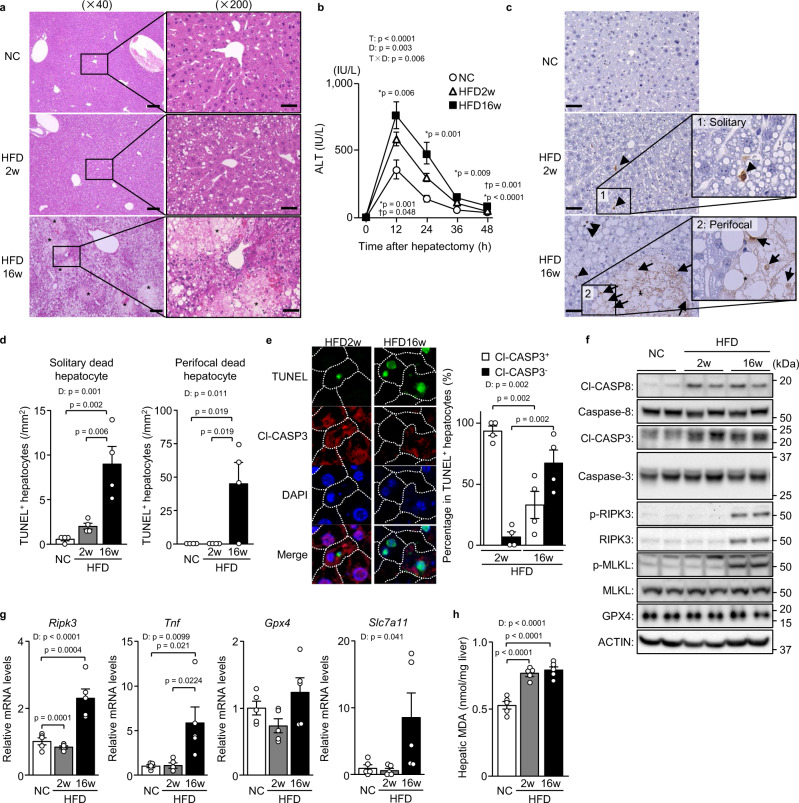
Fig. 1. Non-apoptotic cell death is increased in severe steatosis after hepatectomy.
Mice fed normal chow (NC) or a HFD for 2 or 16 weeks underwent partial hepatectomy. a Haematoxylin-eosin staining. Scale bars, 50 μm (left) and 200 μm (right). Asterisks indicate hepatocellular death foci. b Plasma ALT levels. * indicates p-values for HFD16w versus NC; † indicates p-values for HFD16w versus HFD2w. c TUNEL staining. Scale bar, 50 μm. Arrowheads indicate solitary dead hepatocytes. Asterisks indicate hepatocellular death foci. Arrows indicate perifocal dead hepatocytes. d Number of TUNEL+ hepatocytes defined as described. e TUNEL/Cl-CASP3 double staining (left). Cl-CASP3+ or Cl-CASP3− hepatocytes as a percentage of TUNEL+ hepatocytes (right). f Immunoblot analysis. g Quantitative PCR analysis. h Hepatic MDA levels. Data are presented as the mean values ± SEM. [(b, f–h) n = 5/group; (a and c–e) n = 4/group, biologically independent samples]. Statistics: one-way repeated-measures ANOVA followed by Bonferroni’s multiple comparisons test (b), one-way ANOVA followed by Tukey’s multiple comparisons test (d, g, h), two-tailed Student’s t test (e). CTRL, control; T, time effect; D, diet effect; T×D, time and diet interaction. Source data are provided as a Source Data file.

