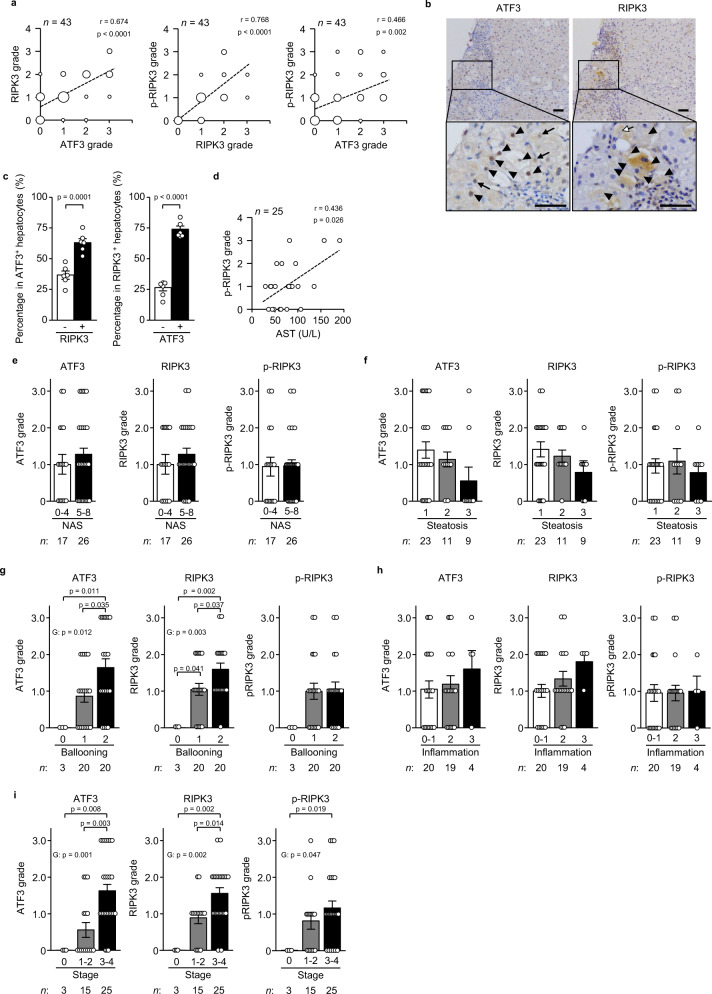
Fig. 10. Hepatic ATF3 and RIPK3 expression in patients with NASH.
Serial sections of liver specimens in NAFLD patients were stained for ATF3, RIPK3 or phosphorylated RIPK3 (p-RIPK3). a Correlation (r) between the ATF3 and RIPK3 grades, between the RIPK3 and p-RIPK3 grades, and between the ATF3 and p-RIPK3 grades, calculated using Spearman’s rank correlation test. b Images of serial sections from human NASH (stages 3 and 4). Arrowheads indicate both ATF3+ and RIPK3+ hepatocytes. Arrows indicate ATF3+ or RIPK3+ hepatocytes. Scale bar, 50 μm. c Percentage of RIPK3+ or RIPK3− hepatocytes in ATF3+ hepatocytes (left). Percentage of ATF3+ or ATF3− hepatocytes in RIPK3+ hepatocytes (right). d Correlation (r) between the p-RIPK3 grade and AST level, calculated using Spearman’s rank correlation test. e–i Semiquantitative evaluation of ATF3, RIPK3 and p-RIPK3 by NAS (e), steatosis (f), ballooning (g), inflammation (h) and fibrosis stage (i). Group comparisons were tested by the Kruskal–Wallis test. Data are presented as the mean values ± SEM. [(a, d–i) Sample size is indicated in each figure. b, c n = 6/group, biologically independent samples]. The liver biopsy samples are biologically independent samples. Source data are provided as a Source Data file.

