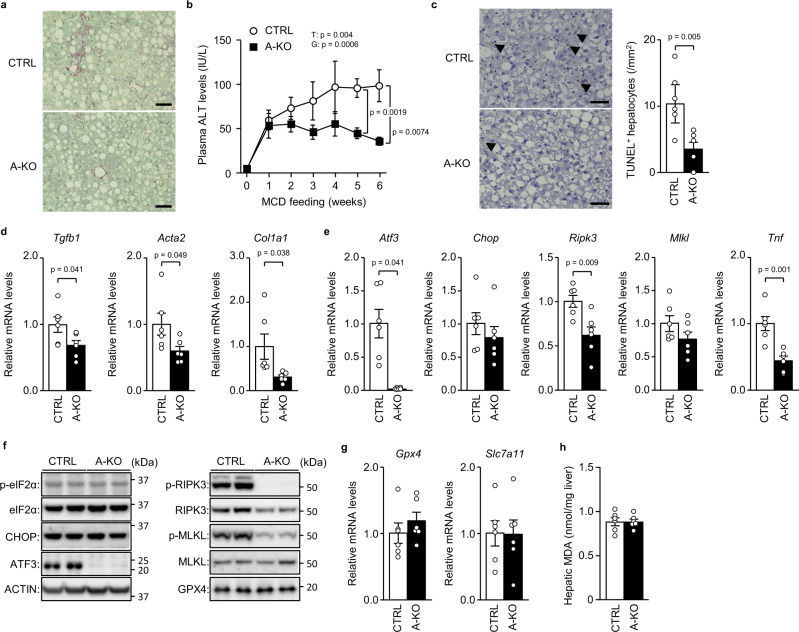
Fig. 9. ATF3 knockout prevents MCD-induced NASH.
A-KO mice and littermates (CTRL) were fed an MCD for 6 weeks. a Sirius red staining. Scale bar, 50 μm. b Plasma ALT levels at the indicated time points. c TUNEL staining (left). Scale bar, 50 μm. Arrowheads indicate TUNEL+ hepatocytes. Number of TUNEL+ hepatocytes (right). d, e Quantitative PCR analysis of genes related to fibrosis (d) and the eIF2α signalling pathway and necroptosis (e). f Immunoblot analysis. g Quantitative PCR analysis of genes related to ferroptosis. h Hepatic MDA levels. Data are presented as the mean values ± SEM. [n = 6/group, biologically independent samples]. Statistics: one-way repeated-measures ANOVA followed by Bonferroni’s multiple comparisons test (b), two-tailed Student’s t test (c–e, g, h). G, group effect; T, time effect. Source data are provided as a Source Data file.

