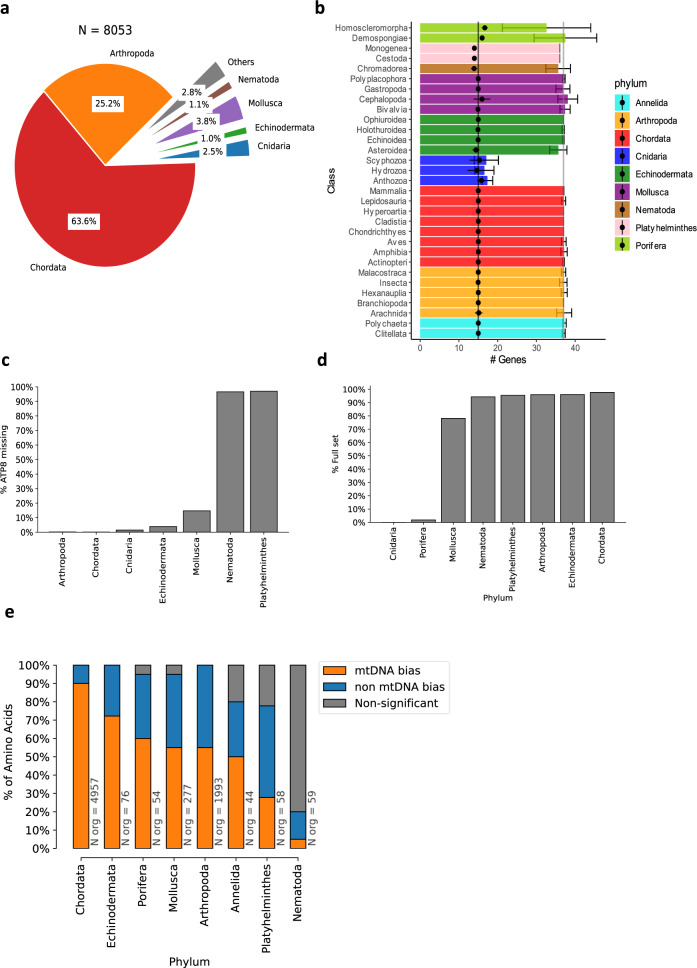
Fig. 1. MtDNA gene content is conserved throughout Metazoa.
a Phylum-level distribution of the 8053 organisms within our analyzed database. b Distribution of the number of different mtDNA genes per taxonomic class, colored by phylum. Black dots represent the number of non-tRNA genes; whiskers correspond to the 95% confidence interval range. The grey and black vertical lines highlight the number of mtDNA genes in humans, with or without tRNA genes, respectively. c Percentage of organisms within each phylum that lack an mtDNA-encoded ATP8. d Percentage of organisms within each phylum that contain the human mtDNA-encoded tRNA gene set, termed here ‘full set’, in the Y axis (i.e., 22 tRNA genes). e Summary statistics of codon bias analysis. Each stacked bar shows the percentage of amino acids with two or more possible codons which display either: Significant bias towards mtDNA codons (orange), a significant tendency towards nuclear DNA codons (blue), or nonsignificant (grey). X axis—phyla analyzed. See also Supplementary Data S3 and Supplementary Data S4 for raw data (https://figshare.com/projects/Shtolz_2022_mtDNA_evolutionary_rearrangements/156008).

