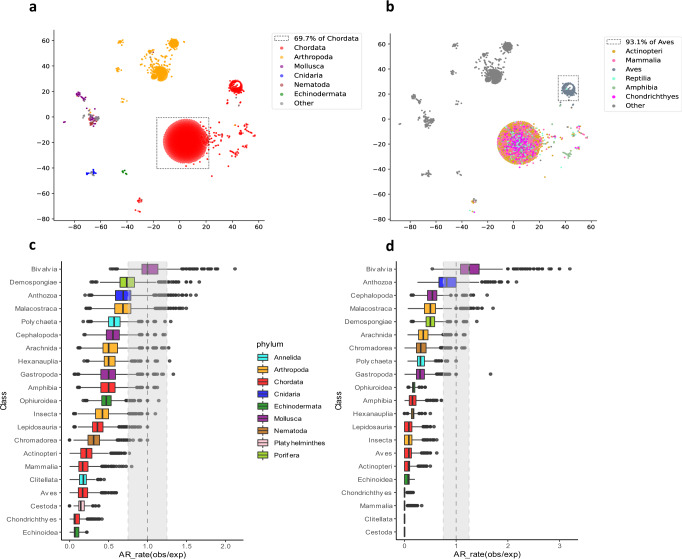
Fig. 2. MtDNA gene order is more conserved within than between phyla.
a, b. tSNE plots of all organisms within the analyzed database, colored either by phylum (a) or while highlighting classes within Chordata (b). Dotted frame—Chordates in (a), birds in (b). c, d Ratio between observed and expected genome architecture (AR rates) within each class, either with (c) or without (d) mt-tRNA genes. The vertical dashed line and grey rectangle show 1:1 ratio (indicating no difference) and ±0.25 interval around it, respectively. The expected AR-rate distribution was calculated by random sampling of 21 organisms from each class followed by label shuffling 10,000 times. The observed distribution was generated by a similar process but without shuffling. See also Supplementary Data S5 and S6 for raw data (https://figshare.com/projects/Shtolz_2022_mtDNA_evolutionary_rearrangements/156008).

