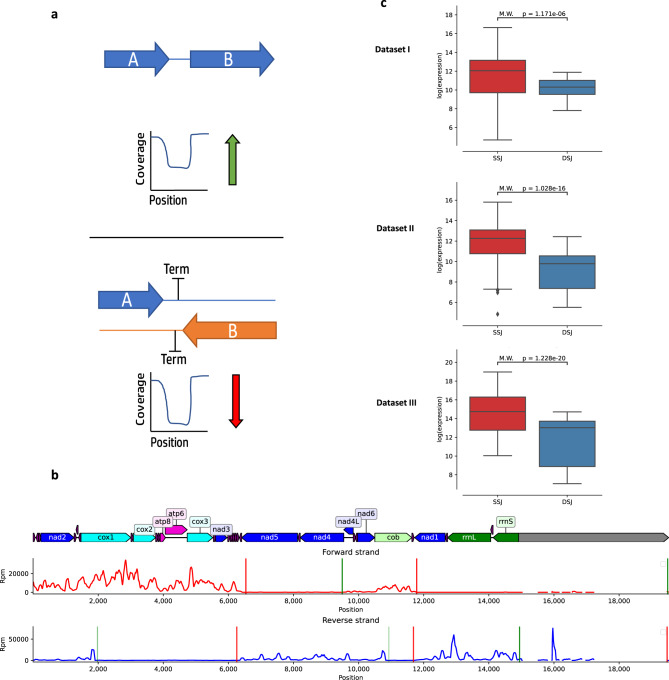
Fig. 4. Gene-gene junctions represent borders between polycistronic units in Drosophila melanogaster.
a An illustration of the expected expression level in junctions between genes from the same strand (SSJ) as compared to junctions between genes encoded by different strands (DSJ). b Analysis of mtDNA sequence read coverage from precision run-on sequencing (PRO-seq) experiments in Drosophila. Forward strand read coverage is colored in red and the reverse strand in blue. Vertical green and red lines mark the predicted transcriptional initiation and termination sites, respectively. The level of vertical line transparency depends on the prediction’s confidence score (see Methods). The numbers below each line correspond to mtDNA positions. c Boxplot comparisons of log normalized expression between DSJ and SSJ in three different Drosophila RNA-seq datasets (See Supplementary Data S2). Each box extends from the 25th to the 75th percentiles, whiskers denote values within 1.5 interquartile range of the percentiles. Dots denote outliers outside of the mentioned ranges. M.W. Mann–Whitney test values. SSJ vs. DSJ effect sizes (Cohen’s d) per-dataset: 0.67, 0.95, and 0.339. See also Supplementary Data S9 and Supplementary Data S10 for raw data (https://figshare.com/projects/Shtolz_2022_mtDNA_evolutionary_rearrangements/156008).

