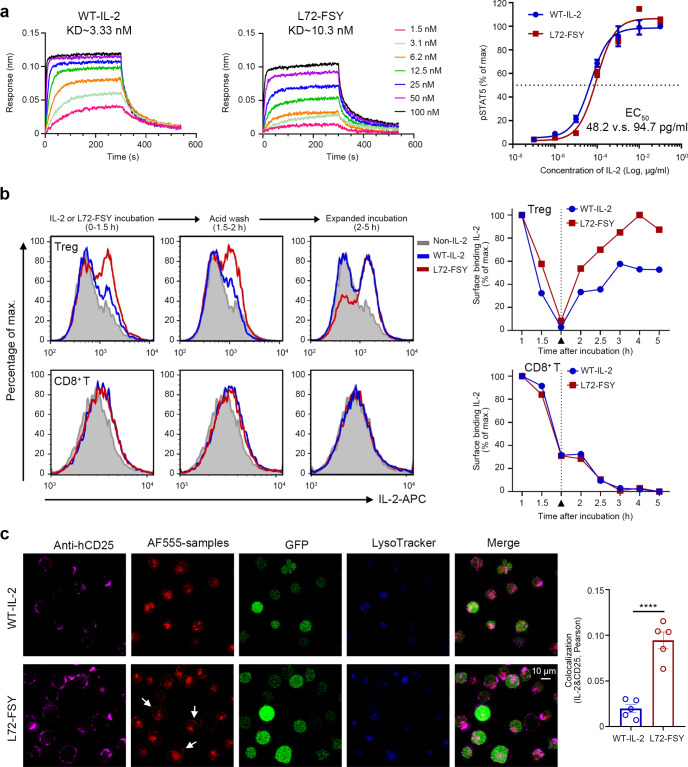
Fig. 2.
FSY-mediated covalent binding specifically augmented the recycling of IL-2 on Treg cells. a Characterization of the effects of FSY mutation on the bioactivity of IL-2. The binding affinities of L72-FSY versus WT-IL-2 were evaluated by biolayer interferometry with biosensors bearing extracellular domains of IL-2Rα. Dose-dependent assessment of the abilities of L72-FSY and WT-IL-2 to activate YT cells expressing CD25-eGFP (CD25-YT) were determined by the pSTAT5 assay. The kinetic parameters and 50% effective concentrations (EC50) of CD25-YT cells in response to each sample were calculated. See also Supplementary Table 1. b Flow cytometry assessment of surface IL-2 on Tregs and CD8+ T cells in response to L72-FSY versus WT-IL-2. The isolated Tregs or CD8+ T cells were incubated with saturating amounts of the samples for 1.5 h. The cells were then washed with acid buffer and replated without cytokines. Tregs were isolated and expanded ex vivo for 9 days prior to the assay. The cells treated at the indicated time points were washed, stained with an anti-IL-2-APC antibody, and analysed by flow cytometry. The cells treated with PBS (non-IL-2) were used as negative control for all samples. The results from one representative donor of three are shown. c Characterization of the effects of IL-2 upon covalent binding to the trimeric IL-2R receptor. CD25-YT (green) were incubated at 37 °C in the presence of saturating Alexa Fluor 555-labelled L72-FSY or WT-IL-2 (red) for 6 h. The acidic compartments were stained with LysoTracker blue BND-22 (blue), and surface IL-2Rα expression was detected with an anti-IL-2α antibody followed by a FITC-conjugated secondary antibody (pink). The discrete punctate structures indicated by the white arrow indicated that surface IL-2 colocalized with IL-2Rα. The colocalization of IL-2Rα and IL-2 was determined by Pearson coefficient analysis, and the data are presented as the mean ± SEM derived from five randomly selected cell regions (n = 5). The p values were determined by two-tailed unpaired Student’s t tests, ****p ≤ 0.0001. Representative results from one of two experiments are shown

