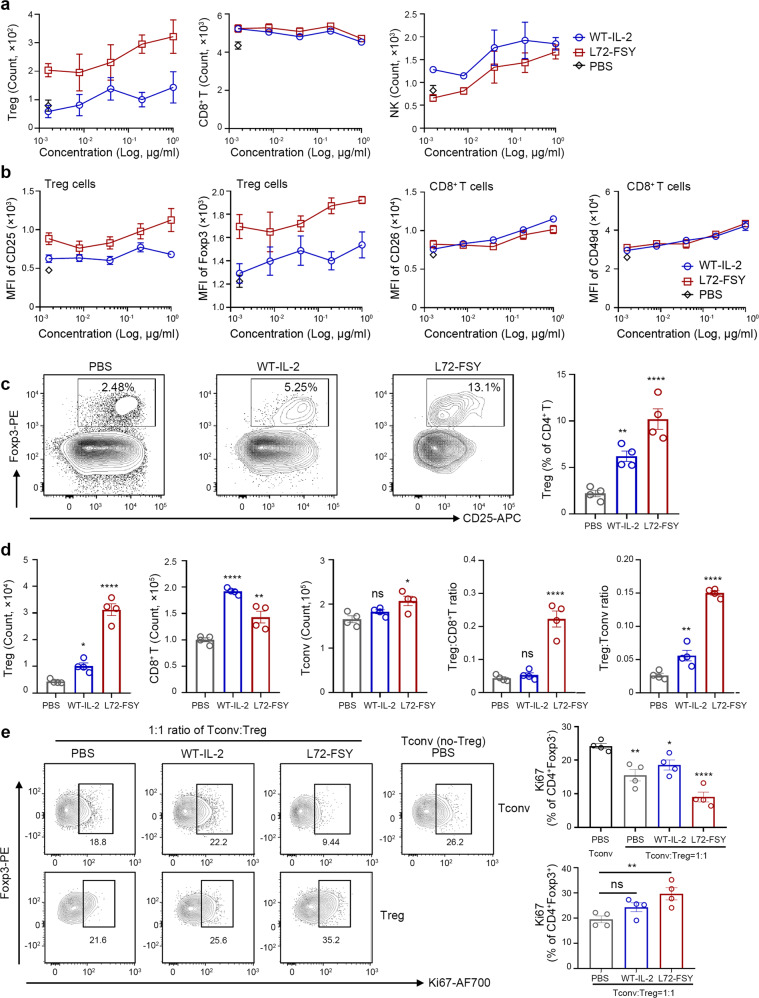
Fig. 3.
L72-FSY preferentially promotes Tregs in vitro and in vivo. (a, b) L72-FSY preferentially promoted the proliferation and activation of Tregs over CD8+ T cells in vitro. Human PBMCs (hPBMCs) were incubated with samples at the indicated concentrations for 6 h, and the cells were then washed with acid buffer and cultured without cytokines for three days. The symbol is plotted as the mean of triplicate wells, with the error bars representing the SEM (n = 3), and one representative donor of three is shown. See also Supplementary Fig. 5. a Dose-dependent changes in the numbers of Tregs, CD8+ T cells and NK cells following incubation with hPBMCs in the presence of the indicated samples. b The expression of IL-2-inducible proteins on Tregs (CD25 and Foxp3) and CD8+ T cells (CD26 and CD49b) in the presence of the indicated concentrations of the indicated samples was evaluated. (c, d) L72-FSY preferentially promoted the proliferation and activation of Tregs in a humanized NSG model in vivo. NSG mice were injected with hPBMCs, followed by subcutaneous administration of 2 μg of WT-IL-2 or L72-FSY daily for ten consecutive days. Splenocytes were harvested five days after the last injection for flow cytometry analysis. See also Supplementary Fig. 7a-b. c Representative flow plots and a bar graph reflecting the changes in the percentage of Tregs among total CD4+ T cells after the indicated treatments. d Bar graphs showing the numbers of Tregs, CD8+ T cells, and Tconv cells and the ratios of Tregs:Tconv cells and Tregs:CD8+ T cells in the spleens of mice receiving the indicated treatments. e L72-FSY selectively potentiated the growth of adoptively transferred Tregs and suppressed transferred Tconv cells in the recipient mouse. NSG mice were cotransferred with isolated human CD4+ Tconv and Treg cells at a ratio of 1:1, followed by the administration of 2 μg of WT-IL-2 or L72-FSY daily for five consecutive days. The Tregs were expanded for two weeks after isolation and labelled with carboxyfluorescein succinimidyl ester (CFSE) prior to injection. Representative flow plots and bar graphs reflecting Ki-67+ proliferating cells in transferred Tregs and Tconv cells after the indicated treatment. See also Supplementary Fig. 7c. Data are representative of 4 (panel c d) or 2 (panel e) independent experiments and are presented as the mean ± SEM of four mice per group (n = 4). The p values were determined by one-way ANOVA (Dunnett’s multiple-comparison test compared with the PBS control), *p ≤ 0.05, **p ≤ 0.01, ****p ≤ 0.0001

