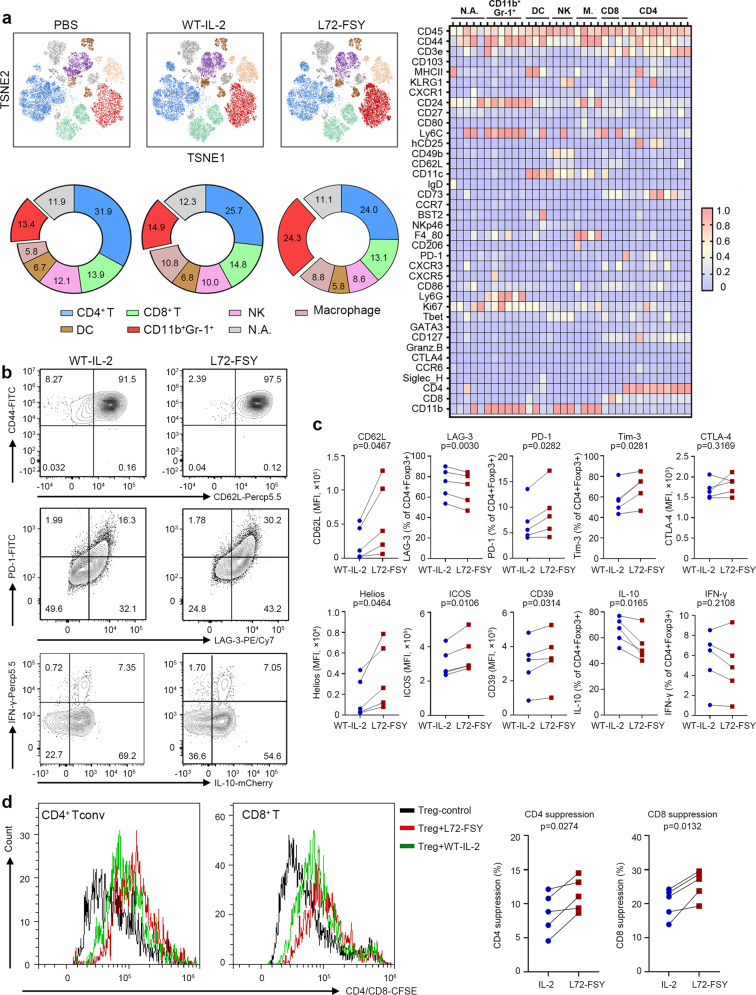
Fig. 4.
Characterization of L72-FSY versus WT-IL-2 in vivo and in vitro. a Profiling of immunocyte populations in the spleen of L72-FSY-treated B-hIL2RA mice by mass cytometry. IL-2Rα-humanized B6 mice (B-hIL2RA mice, three mice per group, n = 3) were subcutaneously injected with PBS, WT-IL-2 or L72-FSY (2 μg) daily for ten consecutive days, and splenocytes were harvested five days after the last injection for mass cytometry. Mice treated with PBS were used as a control. The heatmap of FlowSOM-generated splenic immune cell populations excluding B cells (CD45+CD19-) shows the differential expression of 38 immune markers in the 35 cell clusters. Certain clusters were identified as known cell types within the six cellular clusters according to typically expressed markers. tSNE plots and frequency distributions of immunocytes showing the distinct immune landscape of splenocytes in response to the indicated treatment are depicted. See also Supplementary Fig. 12 and Supplementary Table 2. b, c Profiling of L72-FSY versus WT-IL-2 on Tregs in vitro. Human Tregs were isolated using fluorescence-activated cell sorting (CD3+CD4+CD25highCD127low) and expanded with anti-CD3/CD28 beads in the presence of either L72-FSY or WT-IL-2 (1 μg/ml) ex vivo for two weeks. The samples were re-supplemented every 48 hours. Cells were rested for two days prior to analysis. Representative flow plots (b) and plots graph (c) showing the indicated biomarker after the indicated treatment. d In vitro T cell suppression assay. CFSE-labelled responder CD3+ T cells were prestimulated for 1 day with anti-CD3/CD28 beads and IL-2 and cocultured with or without L72-FSY- or WT-IL-2-expanded Tregs (ratio of 2 CD3+ T cells to 1 Treg). After coculture for three days, the proliferation of responder CD4+ and CD8+ T cells was determined by flow cytometry. Representative flow histograms and averaged data are shown. Percent suppression was calculated as the reduction of the division index in the responder-only control. For panel b, c and d, five different donors are represented (n = 5), and the p values shown were determined by two-tailed paired Student’s t tests

