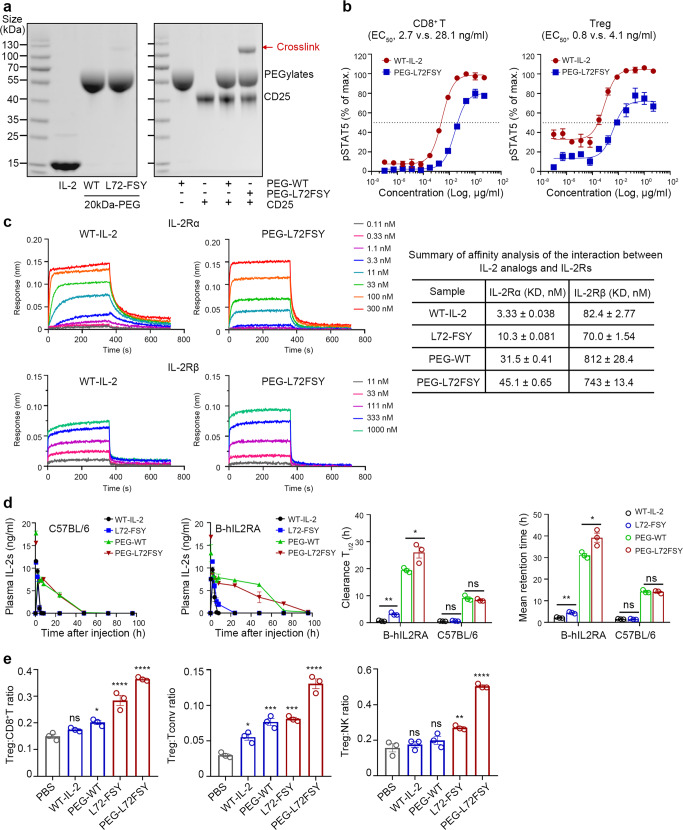
Fig. 5.
PEGylation of L72-FSY and characterization of the effects of PEGylated L72-FSY in vitro and in vivo. a N-terminal site-specific PEGylation of L72-FSY and its capacity to covalently bind to IL-2Rα were verified by Coomassie blue staining. IL-2 was incubated with a 5-fold molar excess of 20-kDa propionaldehyde polyethylene glycol (pALD-PEG) in the presence of sodium cyanoborohydride at pH 4.0 overnight. b Dose-dependent assessment of the ability of PEG-L72FSY or WT-IL-2 to activate Tregs and CD8+ T cells was performed by the pSTAT5 assay. hPBMCs from healthy donors were stimulated with the indicated samples in a series of 5-fold dilutions and then stained for quantitative flow analyses. The EC50 values of the above responses for the indicated cell populations were calculated and are shown. The symbol is plotted as the mean of triplicate wells, with the error bars representing the SEM derived from one donor, and the data are representative of three individual donors (n = 3). c Characterization of the binding affinities of the indicated samples for the extracellular domains of the α or β subunit of IL-2R by biolayer interferometry. The data are presented as the mean ± SD derived from indicated concentrations in a series of 3-fold dilutions. For panels b, c, all parameters are provided in Supplementary Table 3. d Characterization of the effects of PEGylation on the persistence of IL-2 circulation in two strains of mice. C57BL/6 and B-hIL2RA mice were subcutaneously injected with 5 µg of the indicated samples, and blood was collected at the indicated time points for quantification by ELISA. Bar graphs showing the comparisons of the persistence of the indicated samples in the circulation according to the calculated clearance half-life (T1/2) and mean retention time (MRT). All pharmacokinetics parameters are shown in Supplementary Table 4. e Validation of Treg-selective activation by PEG-L72FSY, as reflected by increased ratios of Treg:CD8+T, Treg:Tconv, and Treg:NK cells in treated B-hIL2RA mice. See also Supplementary Fig. 15. For panels (d, e), the data are presented as the mean ± SEM of three mice per group (n = 3), and representative results from one of two experiments are shown. The p values were determined by two-tailed unpaired Student’s t tests (panel d) and one-way ANOVA (Dunnett’s multiple-comparison test compared with PBS group, panel e), *p ≤ 0.05, **p ≤ 0.01, ***p ≤ 0.001, ****p ≤ 0.0001. The concentrations of PEGylated IL-2 reflect the molecular mass of IL-2 without the attached PEG

