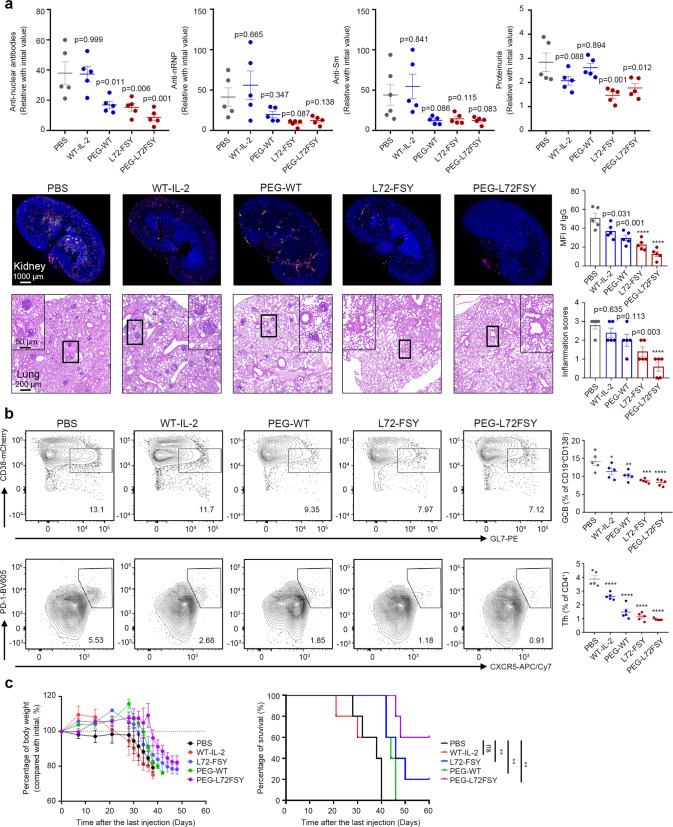
Fig. 6.
FSY-bearing IL-2 variants ameliorated SLE in a pristane-induced lupus model in B-hIL2RA mice and prevented GvHD aggravation. a, b B-hIL2RA mice were intraperitoneally injected with 0.5 ml of pristane. The establishment of lupus was confirmed by the detection of proteinuria two months later, and subcutaneous injection of the indicated samples at the indicated time points was then performed. The mice were sacrificed two weeks after the final injection for histopathological and immunohistochemical analyses. See also Supplementary Fig. 16-18. a The ability of FSY-bearing IL-2 variants to ameliorate signs of lupus, as demonstrated by reduced levels of proteinuria, serum anti-nuclear antibodies (ANAs), anti-ribonucleoprotein (rRNP) antibodies, anti-Smith (anti-Sm) antibodies, IgG and IgM deposition in the kidneys, and lymphocyte infiltration in the lung at the end of the experiment. Cryosections from the kidney were stained with anti-mouse IgG (red) and IgM (green), followed by analysis by fluorescence microscopy. IgG deposition was determined based on the MFI, which was calculated using ImageJ. The histological H&E inflammation score of the lungs, based on a 0-3 scale, was estimated according to the reported scoring criterion described in the supplementary methods section. b Representative flow plots and bar graphs reflecting the percentage changes in B cells with a GC phenotype (CD38lowGL7high) and Tfh (CXCR5+PD-1+) cells among CD19+CD138- B cells and CD4+ T cells, respectively, after the indicated treatment. c The effects of L72-FSY, WT-IL-2 and their PEGylated counterparts on a xeno-GvHD mouse model. A lethal dose of activated hPBMCs from healthy donors was injected into NSG mice, followed by subcutaneous injection of 1 μg of WT-IL-2 or FSY-72 for ten consecutive days or an equal dose of their PEGylated forms every other day five times. The weight curves and Kaplan–Meier survival curves of the grafted mice are shown. The data are presented as the mean ± SEM of 5 mice for panels a, c (n = 5), and the p values were determined by one-way ANOVA (Dunnett’s multiple-comparison test compared with the PBS group) for panels (a, b) and by the Mantel−Cox test for panel c. *p ≤ 0.05, **p ≤ 0.01, ***p ≤ 0.001, ****p ≤ 0.0001. The concentrations of PEGylated IL-2 reflect the molecular mass of IL-2 without the attached PEG

