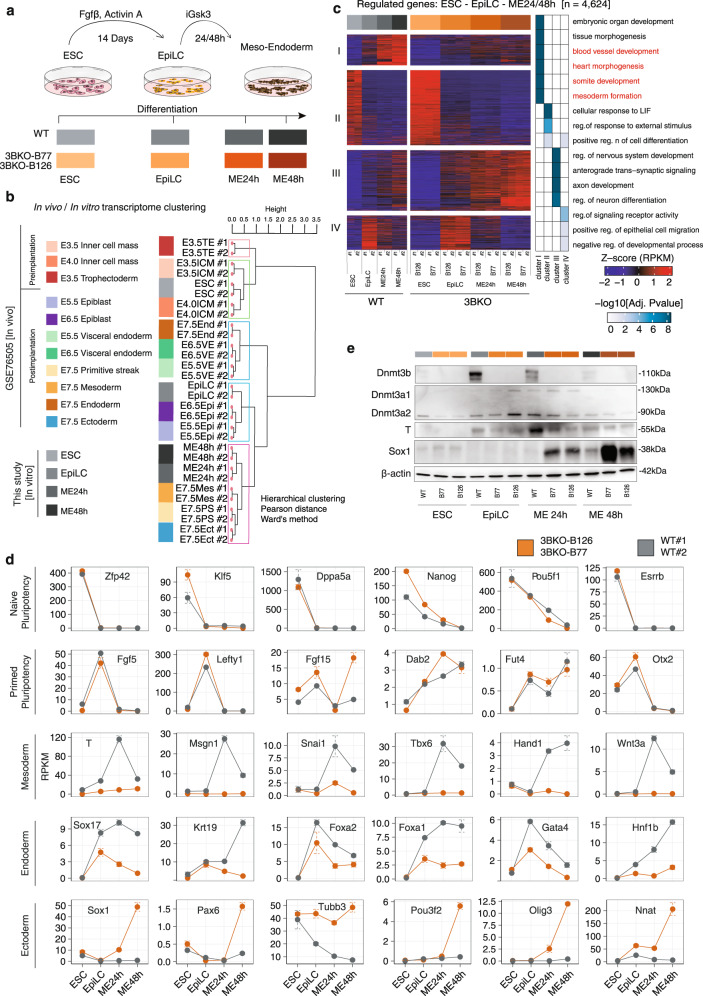
Fig. 2. Loss of DNMT3B impairs meso-endoderm lineage commitment.
a Schematic representation of the two-step differentiation model from ESCs to EpiLCs first with Fgfβ and Activin A, and then to meso-endoderm (ME) progenitors with iGsk3. The time points of cells’ collection are reported in the colour-code used throughout the figures (i.e., shades of grey for WT, shades of orange for 3BKO). b Hierarchical clustering of RNA-seq data from the in vitro differentiation and in vivo embryonic tissues derived from pre- and post-implantation mouse embryos35. Pearson’s correlation distance and Ward’s method were employed to perform the analysis. c On the left, an RNA-seq heatmap showing the results of gene expression profiles clustering with K-means for WT and 3BKO (two independent clones) cells during the complete differentiation time course (ESC-EpiLC-ME). DEGs arising during the differentiation time course in any group were identified by ANOVA-like test with edgeR54. Rows are genes, columns are samples and the scaled expression level (Z-score RPKM) is plotted. On the right, heatmap showing selected GO terms for enriched biological processes in each cluster. Terms related to meso-endoderm are highlighted in red. d Gene expression time-course for stage-specific pluripotency (naive, primed) and germ layers (mesoderm, endoderm, ectoderm) marker genes. Dots represent normalized RPKM values, averaged by replicates/conditions (n = 2 biological replicates for each genotype or clone at each time point). Error bars represent standard errors. e, Western blot analysis of the de novo DNMTs (Dnmt3a1, Dnmt3a2, Dnmt3b), T (mesodermal marker) and Sox1 (neuro-ectodermal marker) expression during the differentiation time course. β-actin serves as loading control. Representative of two independent experiments. Uncropped gels are provided in Supplementary Fig. 11.

