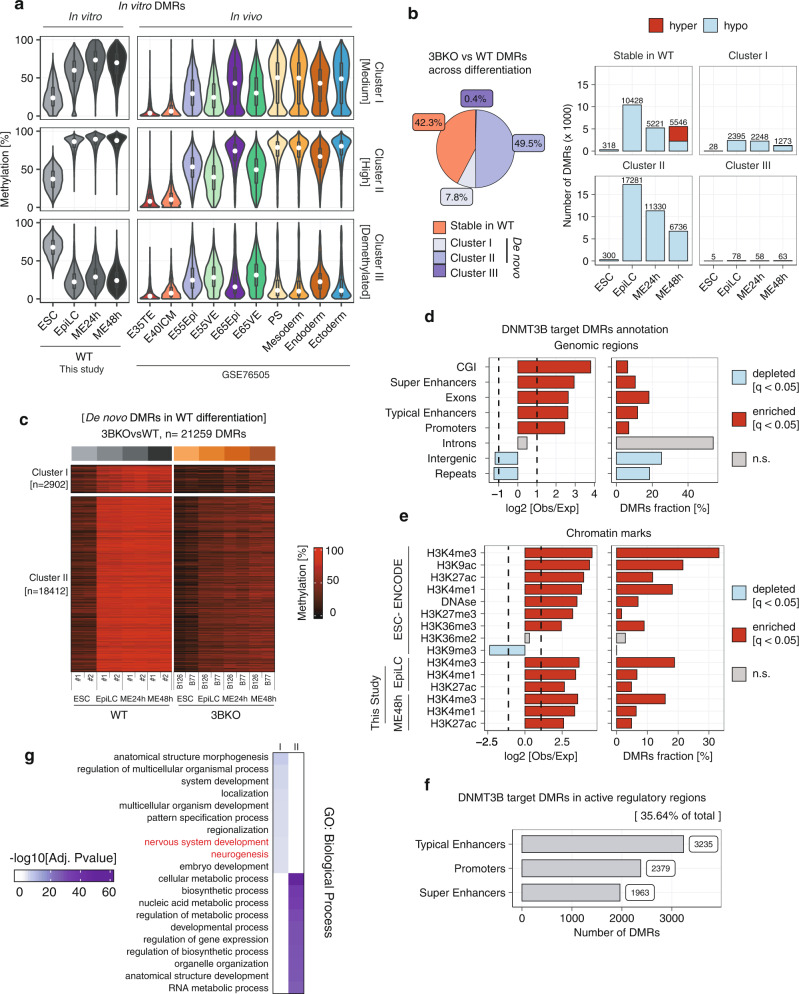
Fig. 4. WGBS analysis identifies DNMT3B-dependent de novo methylated regions during ESC-EpiLC-ME differentiation.
a Violin plots comparing the behaviour of DNAme levels (as average %) at the DMRs identified in WT differentiation (see Supplementary Fig. 6) between in vitro differentiation and in vivo embryonic and extraembryonic tissues from published data35. White dots indicate median, box indicates the interquartile range (IQR) and whiskers denote the 1.5 × IQR. b (left) Pie chart of proportions of DMRs identified during the ESC-EpiLC-ME differentiation in 3BKO cells, divided as “stable in WT” or belonging to WT differentiation cluster I, II or III. (right) Barplots showing the number of 3BKO versus WT DMRs in each group, coloured according to hypo- (pale blue) or hyper- (red) methylation. c WGBS heatmap visualising the DNAme dynamics across differentiation between 3BKO and WT for the two DMR clusters (cluster I and II) that are targets of DNMT3B for de novo DNAme. d, e Annotation of DMRs for the overlap with distinct genomic regions (d) and chromatin marks (e), reported as (left) the log2-enrichment for each feature and (right) the percentage of DMRs overlapping each feature, calculated with the Genomic Association Test (GAT) tool39. Bars are coloured according to the statistical significance (q-value < 0.05) of each feature (enriched = red, depleted = pale blue, non-significant = grey). f Barplot showing the number of DNMT3B target DMRs overlapping regulatory regions (promoters, typical and super enhancers). Typical and super enhancers were defined by the H3K27ac signal profiles across differentiation using ROSE60 (Supplementary Fig. 8). g Heatmap showing adjusted p-values for selected GO terms fof enriched biological processes in each cluster. Gene set over-representation analysis was performed for genes associated with DMRs overlapping putative regulatory regions using hypergeometric tests as implemented in GREAT63.

