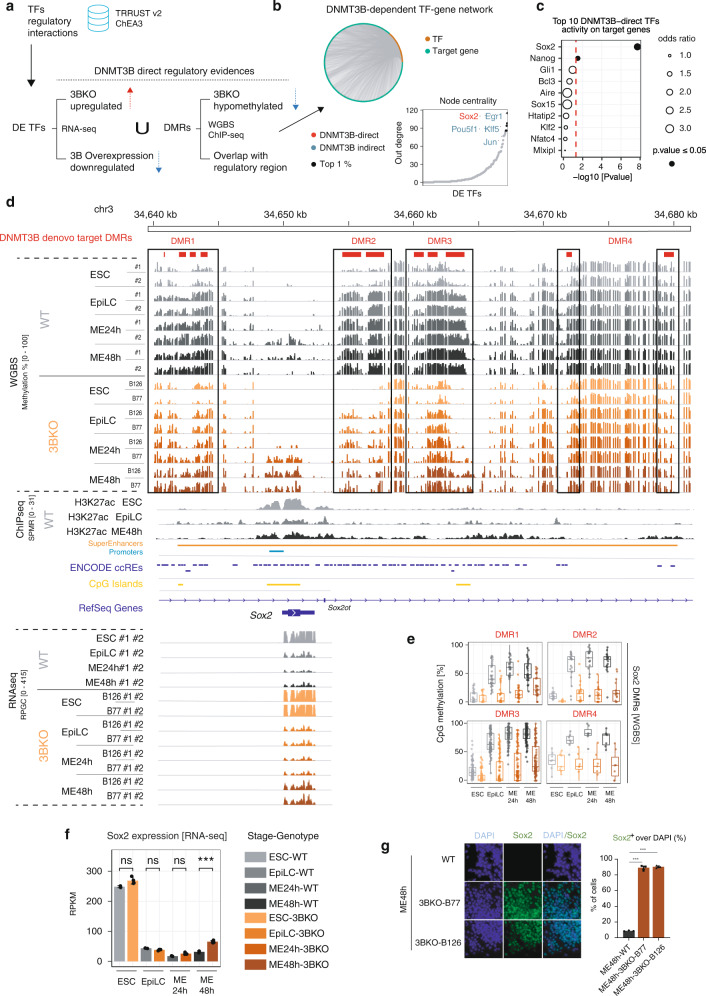
Fig. 6. DNMT3B-dependent DNA methylation regulates the super-enhancer of Sox2 neuro-ectodermal master regulator.
a Schematic of the workflow for the DNMT3B-dependent regulatory network reconstruction. Starting from the integrated TF-target regulatory interactions retrieved from TRRUSTv240 and ChEA341 databases, the network was filtered for DEGs and the DNMT3B-direct regulatory evidence was used to classify nodes as direct (i.e. upregulation in 3BKO, downregulation in DNMT3B overexpression, association to at least one 3BKO-hypomethylated DMR overlapping a regulatory region) or indirect. b (top) Circular layout visualization of the reconstructed DNMT3B-dependent transcriptional regulatory network. Dark orange nodes are TFs, green nodes are target genes. (bottom) Node ranking on the basis of their out-degree centrality (i.e. number of regulated genes). Black dots represent the top 1%. DNMT3B direct TF names are depicted in red, indirect in blue. c Plot of TFs activity on target genes, measured as their enrichment among DEGs between 3BKO and WT samples using Fisher’s exact test. The x-axis reports the −log10(P-value). Dot size represents the odds ratio. Dot colour represents statistical significance above (white)/below (black) 0.05. d Genome browser view showing the WGBS, ChIP-seq and RNA-seq signal profiles across differentiation (ESC-EpiLC-ME) for WT and 3BKO cells on a ~40 kb window surrounding Sox2 gene locus. Four DMRs identified as DNMT3B de novo target DMRs are present in this region, named as DMRs [1–4] (depicted in red and indicated in the rectangles). These DMRs overlap with the Sox2-associated super enhancer (identified by H3K27ac ChIP-seq signals and previously annotated in ref. 42. Annotations for regulatory regions (promoters/typical and super enhancers, as defined by ChIP-seq data), CpG islands and ENCODE candidate cis-regulatory elements (ccREs) for mouse mm1064 are also reported. e Quantification of CpG DNAme (as %) from WGBS of the four identified DMRs [1–4] in Sox2 locus, in WT and 3BKO cells (average of n = 2 biological replicates for each genotype or clone at each time point). Horizontal line indicates median, box indicates the interquartile range (IQR) and whiskers denote the 1.5 × IQR. f Sox2 gene expression levels from RNA-seq (RPKM) over the differentiation time course, in WT and 3BKO cells (***p < 0.001). Bars represent normalized RPKM values, averaged by replicates/conditions (n = 2 biological replicates for each genotype or clone at each time point, shown as dots). Error bars represent standard errors. g Representative IF of Sox2 in WT and 3BKOs at ME48h stages. Quantification of Sox2+ cells over DAPI is reported as a barplot on the right (***p < 0.001, ANOVA test). Bars indicate mean ± SEM of n = 3 independent experiments for each genotype or clone, shown as dots). Error bars represent standard errors.

