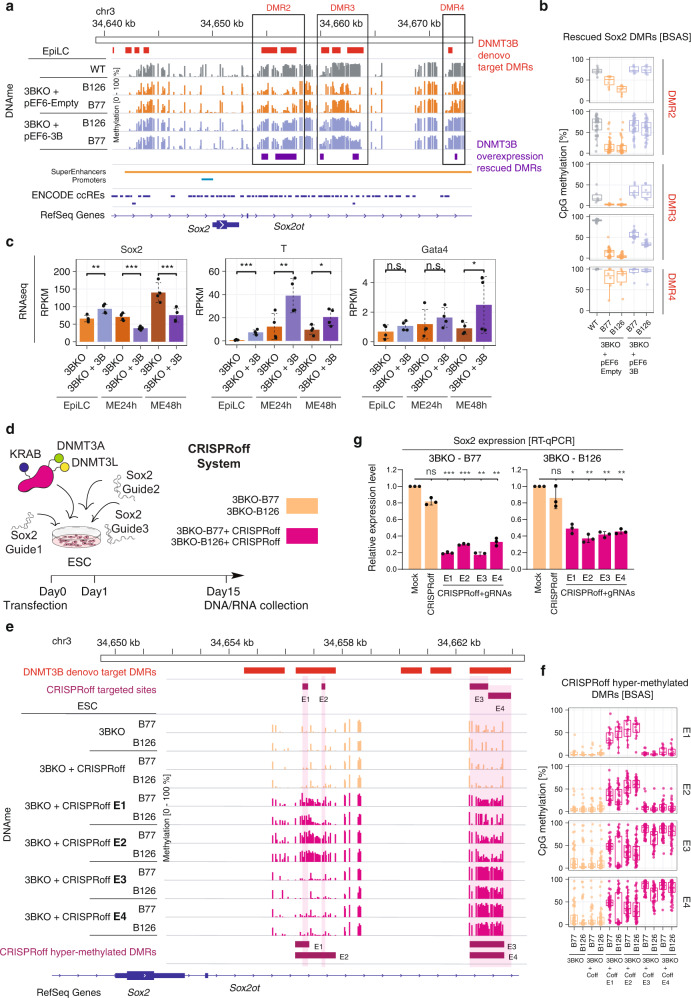
Fig. 7. The expression of Sox2 is inhibited by DNAme on Sox2 super-enhancer.
a Genome browser view of the BSAS signal profiles after DNMT3B overexpression in 3BKO clones at the EpiLC stage on a ~40 kb window surrounding Sox2 gene locus. Signal profiles for WT, 3BKO + Empty vector (control) and 3BKO + 3B (Rescued) cells are reported. Three out of four DNMT3B de novo target DMRs (depicted in red), i.e., DMR2,3 and 4, displayed significant rescue of the DNAme levels upon DNMT3B overexpression (depicted in purple). b, Boxplots showing quantification of CpG DNAme (as %) from BSAS of the three identified DMRs [2, 3, 4] in Sox2 locus displaying significant rescue upon DNMT3B overexpression, in 3BKO + Empty vector (control) and 3BKO + 3B cells (Rescued) (n = 2 independent clones for each condition). Horizontal line indicates median, box indicates the interquartile range (IQR) and whiskers denote the 1.5 × IQR. c Barplots of gene expression leves from RNA-seq of the representative lineage markers Sox2 (neuro-ectoderm), T (mesoderm) and Gata4 (endoderm) in DNMT3B overexpression and 3BKO control samples across EpiLC-ME differentiation. d Schematic of 14-day CRISPRoff protocol indicating the timing and the steps. e Genome browser view of the BSAS signal profiles in 3BKO control samples and 3BKO transfected with CRISPRoff and Sox2 enhancers (E) specific guides on a ~15 kb window surrounding Sox2 gene locus. An increase in DNAme levels is observed at the targeted sites (E1–E4, depicted in purple). f Boxplots showing quantification of CpG DNAme (as %) from BSAS of the CRISPRoff hyper-methylated DMRs in the Sox2 locus (n = 2 independent clones for each condition). Horizontal line indicates median, box indicates the interquartile range (IQR) and whiskers denote the 1.5 × IQR. g Bar graphs of normalised Sox2 expression levels from quantitative RT-qPCR of cells transfected with CRISPRoff and gRNAs targeting the four super enhancer elements (E1–E4). Each dot represents one experimental replicate. (ANOVA test, ***p < 0.001, **p < 0.01, *p < 0.05, ns: not significant).

