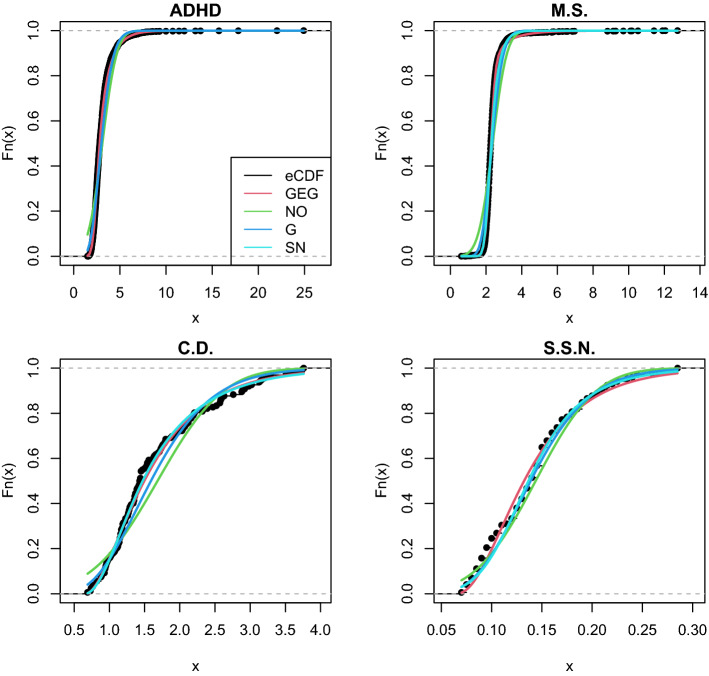
Fig. 2.
Empirical CDFs of four real-life data sets and four fitted theoretical CDFs. The data distributions are represented by black dots (eCDF). Note that the NO distribution tends to miss the tails of the data (e.g. in data sets M.S. and C.D.) and in other cases it misses the data locations (e.g. in the C.D. data set). Note there is a trade-off between interpretability and fitness (i.e. accuracy and flexibility) that requires careful consideration when selecting a distribution to model data. GEG = four-parameters Generalised Exponential-Gaussian distribution; NO = two-parameter Normal distribution; G = two-parameter Gamma distribution; SN = three-parameter Skew-Normal distribution. The x axis represents RTs (these were divided by 100 to improve numerical stability). See Table 3 for the results of the fits

